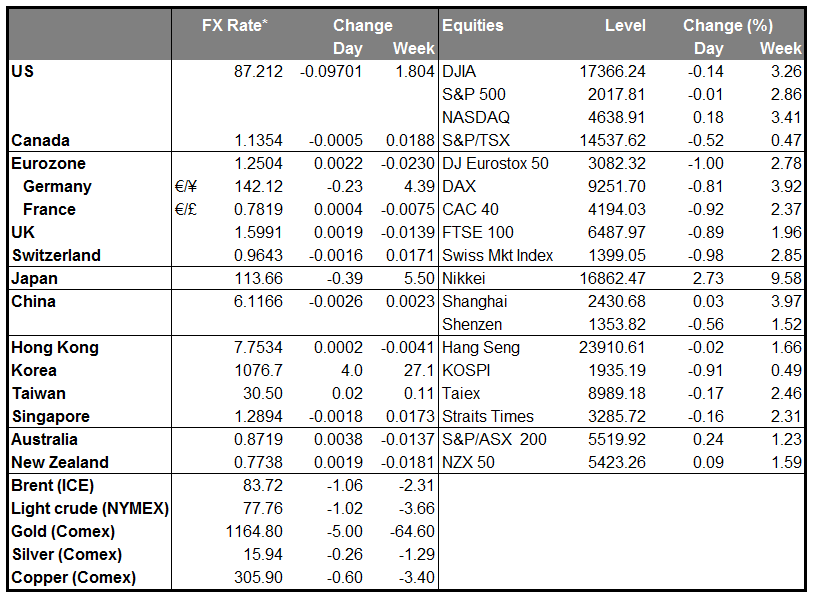
EUR/USD rebounds back above 1.2500
EUR/USD moved higher on Monday to trade back above the 1.2500 line. Taking into account our momentum signs, I would stay watchful that the rebound may continue. The RSI exited its oversold zone and moved higher, while the MACD has bottomed and seems willing to cross above its trigger. However, since the possibility for a lower high still exists, I would stick to the view that the near-term outlook stays negative. I would treat this rebound or any extensions of it as a corrective wave before sellers take the reins again. I would expect a clear dip below the support of 1.2400 (S2) to trigger another strong leg down, perhaps towards the 1.2300 (S3) area, defined by the low of the 20th of August 2012. As for the broader trend, as long as the price structure is lower peaks and lower troughs below both the 50- and the 200-day moving averages, the overall trend remains to the downside in my view.
• Support: 1.2435 (S1), 1.2400 (S2), 1.2300 (S3).
• Resistance: 1.2550 (R1), 1.2635 (R2), 1.2700 (R3).
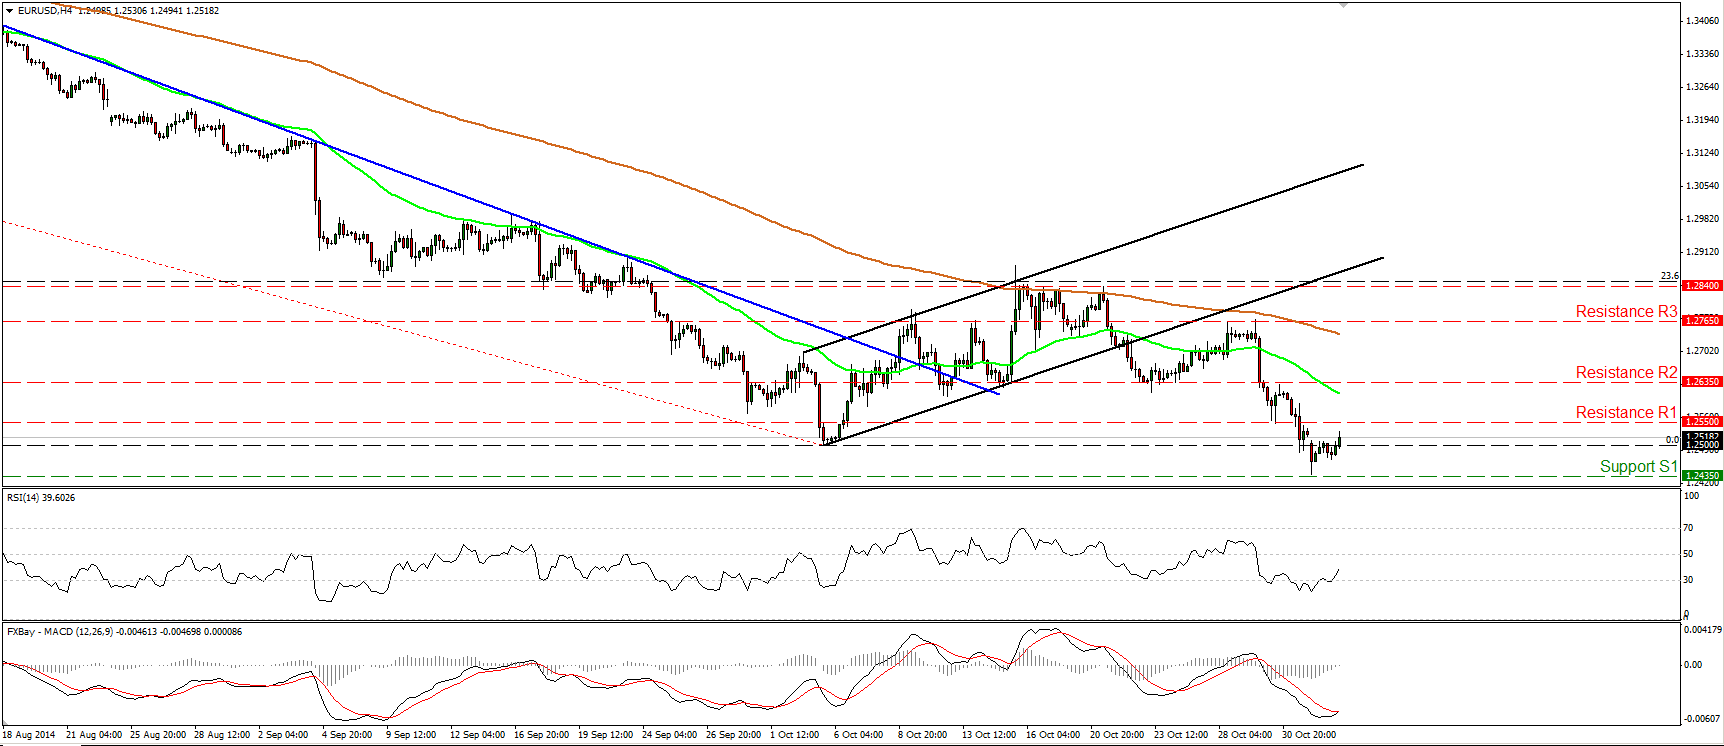
GBP/JPY pauses at 182.50
GBP/JPY continued its rally on Monday to reach and break above the psychological zone of 180.00 (S2). The surge found resistance at 182.50 (R1), where a clear upside break could trigger extensions towards the next psychological zone of 185.00 (R2). Nonetheless, checking our momentum oscillators, I would expect a short-term pullback before the next up leg. The RSI lies within its overbought territory and is pointing somewhat down, while the MACD has topped and could cross below its signal line in the near future. As for the bigger picture, the move above the high of the 19th of September, at 180.70 (S1), confirmed a higher high on the daily chart and this keeps the overall outlook of the pair positive.
• Support: 180.70 (S1), 180.00 (S2), 178.00 (S3).
• Resistance: 182.50 (R1), 185.00 (R2), 188.50 (R3).
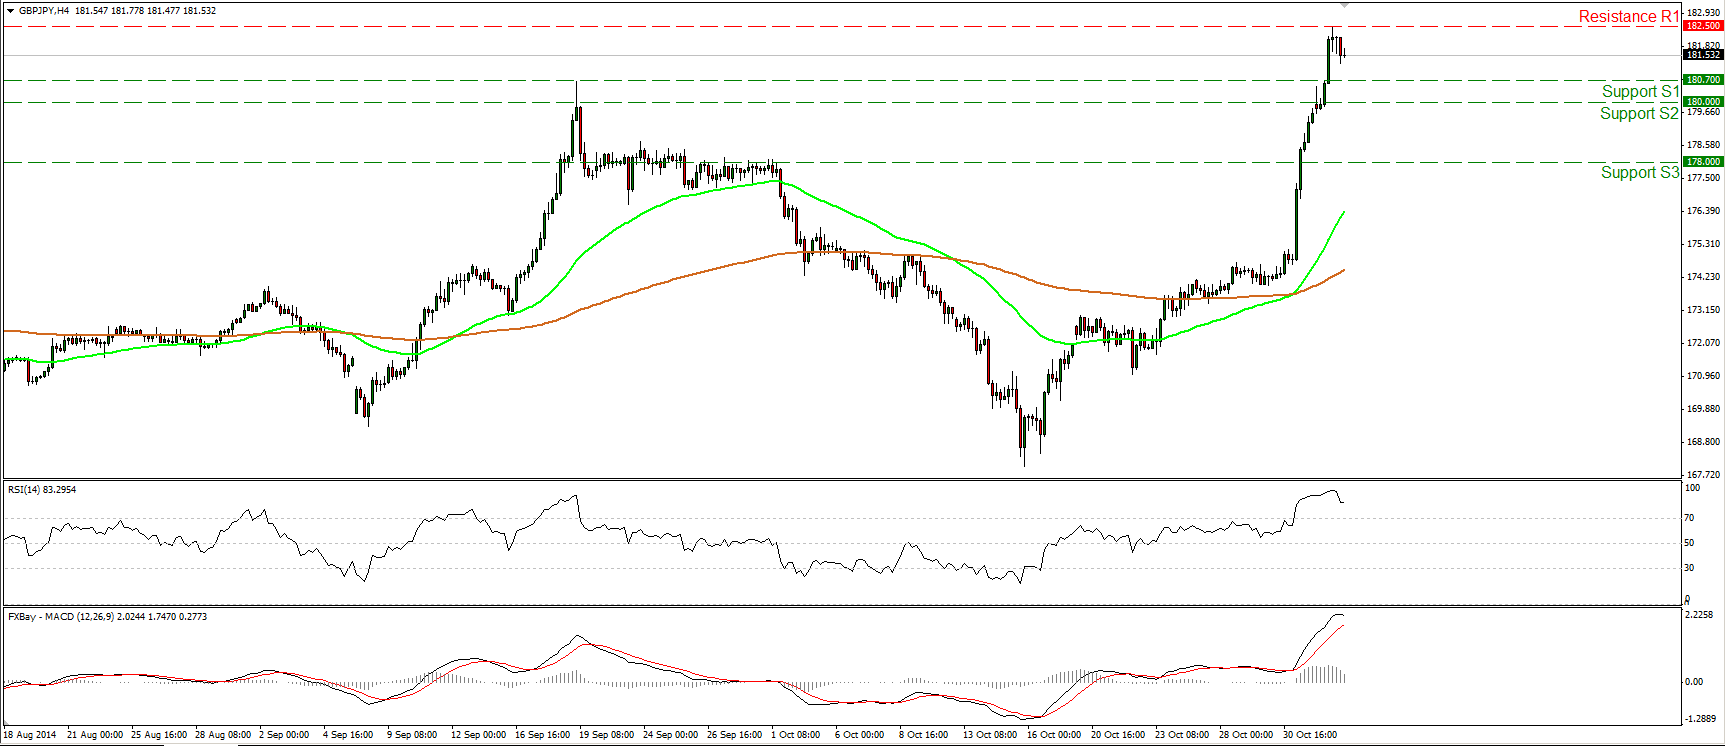
AUD/USD stays within its sideways path
AUD/USD moved lower yesterday, but after finding support near the 0.8640 (S1) hurdle, it rebounded somewhat. The rate remains within a sideways range between the 0.8640 (S1) support obstacle and the resistance of 0.8900 (R3). Our oscillators show that the pair could stay within this path for a bit longer. The RSI rebounded from slightly above its 30 line and is now pointing up, while the MACD, although negative, shows signs of bottoming and could move above its signal line soon. As a result, I will maintain my flat approach and I will prefer to wait for the pair to exit the sideways path.
• Support: 0.8640 (S1), 0.8565 (S2), 0.8500 (S3).
• Resistance: 0.8760 (R1), 0.8850 (R2), 0.8900 (R3).
Gold in a quiet mode

Gold traded in a consolidative manner on Monday, remaining between the 1160 (S1) hurdle, which happens to be the 61.8% retracement level of the October 2008 - September 2011 major advance, and the key support-turned-into-resistance barrier of 1180 (R1). If the bears are strong enough to overcome the 1160 (S1) I would expect them to target the low of the 19th of April 2010, at 1125 (S2). I believe that as long as the 1180 line holds as a resistance, the outlook of the precious metal remains negative. However, bearing in mind our momentum signs, I would be watchful of a possible upside corrective wave before the bears pull the trigger again. The RSI appears willing to exit its oversold territory any time soon, while the MACD just crossed above its signal line.
• Support: 1160 (S1), 1125 (S2), 1100 (S3).
• Resistance: 1180 (R1), 1205 (R2), 1222 (R3).
WTI breaks below 79.40
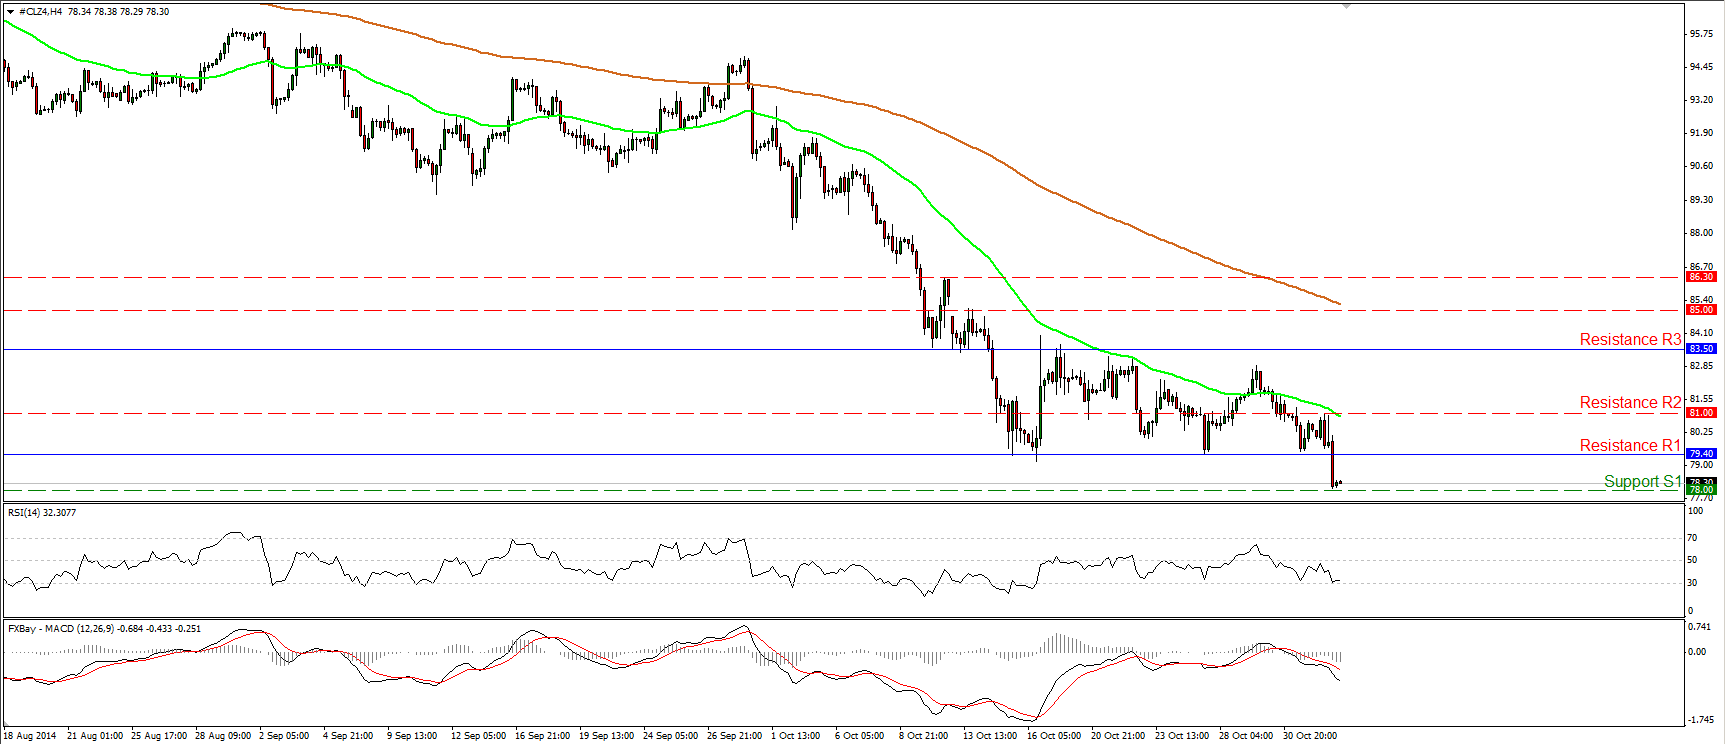
WTI dipped below 79.40 (R1), the lower bound of the sideways range it’s been trading recently, as Saudi Arabia cut prices for crude exports to US customers. The fall found support near the 78.00 (S1) line, where a clear break could have larger bearish implications and perhaps pave the way towards the psychological zone of 75.00 (S2), defined by the lows of October 2011. The plummet below the 79.40 (R1) barrier confirmed a forthcoming lower low on the daily chart and turned the bias back to the downside in my view. Moreover, the 14-day RSI moved lower and appears willing to enter again its oversold field, while the daily MACD, already negative, has turned down and could cross below its signal line any time soon. This shows accelerating bearish momentum and magnifies the case for further declines in the close future.
• Support: 78.00 (S1), 75.00 (S2), 71.00 (S3).
• Resistance: 79.40 (R1), 81.00 (R2), 83.50 (R3).
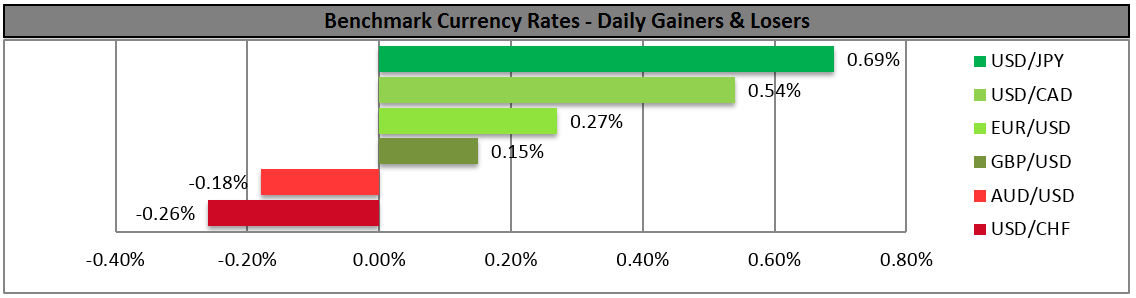
BENCHMARK CURRENCY RATES - DAILY GAINERS AND LOSERS
MARKETS SUMMARY