EUR/USD challenges 1.3152 as a resistance
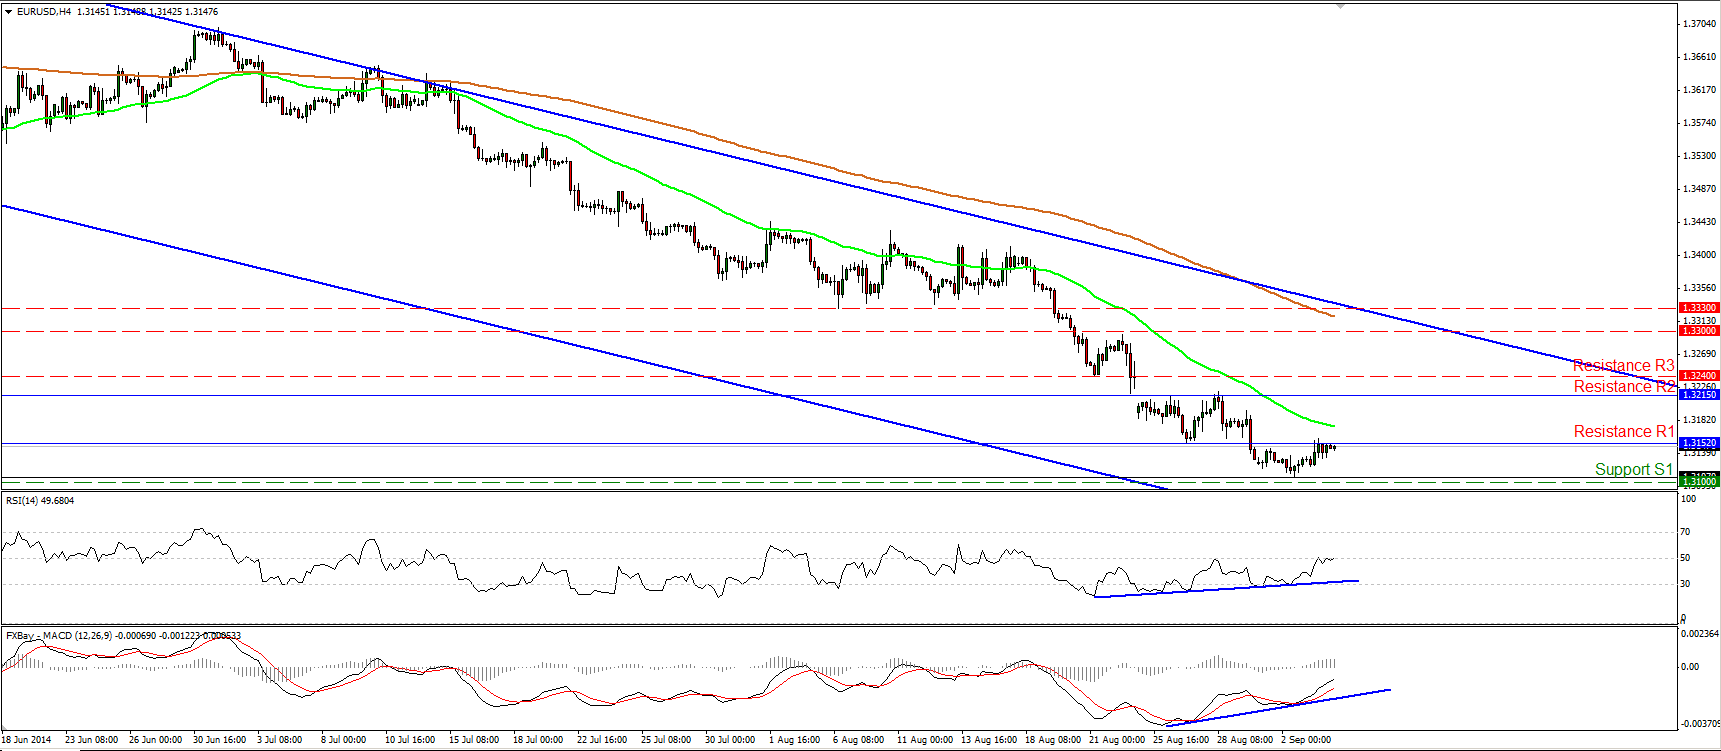
EUR/USD moved somewhat higher on Wednesday to challenge the prior support line of 1.3152 (R1) as a resistance this time. I would like to remain to the sidelines for the same three reasons as yesterday: 1) The pair formed a possible low near the 1.3100 support zone and near the lower line of the blue downside channel connecting the highs and the lows on the daily chart; 2) I still see positive divergence between our momentum studies and the price action, and 3) today we have the ECB policy meeting, which could bring a surprise either way. I will repeat that although I stay flat for now, having in mind that the pair is trading within the aforementioned downside channel and also below bot the 50- and the 200- day moving averages, I still see a negative overall picture.
• Support: 1.3100 (S1), 1.3000 (S2), 1.2900 (S3).
• Resistance: 1.3152 (R1), 1.3215 (R2), 1.3240 (R3).
GBP/JPY hits the uptrend line
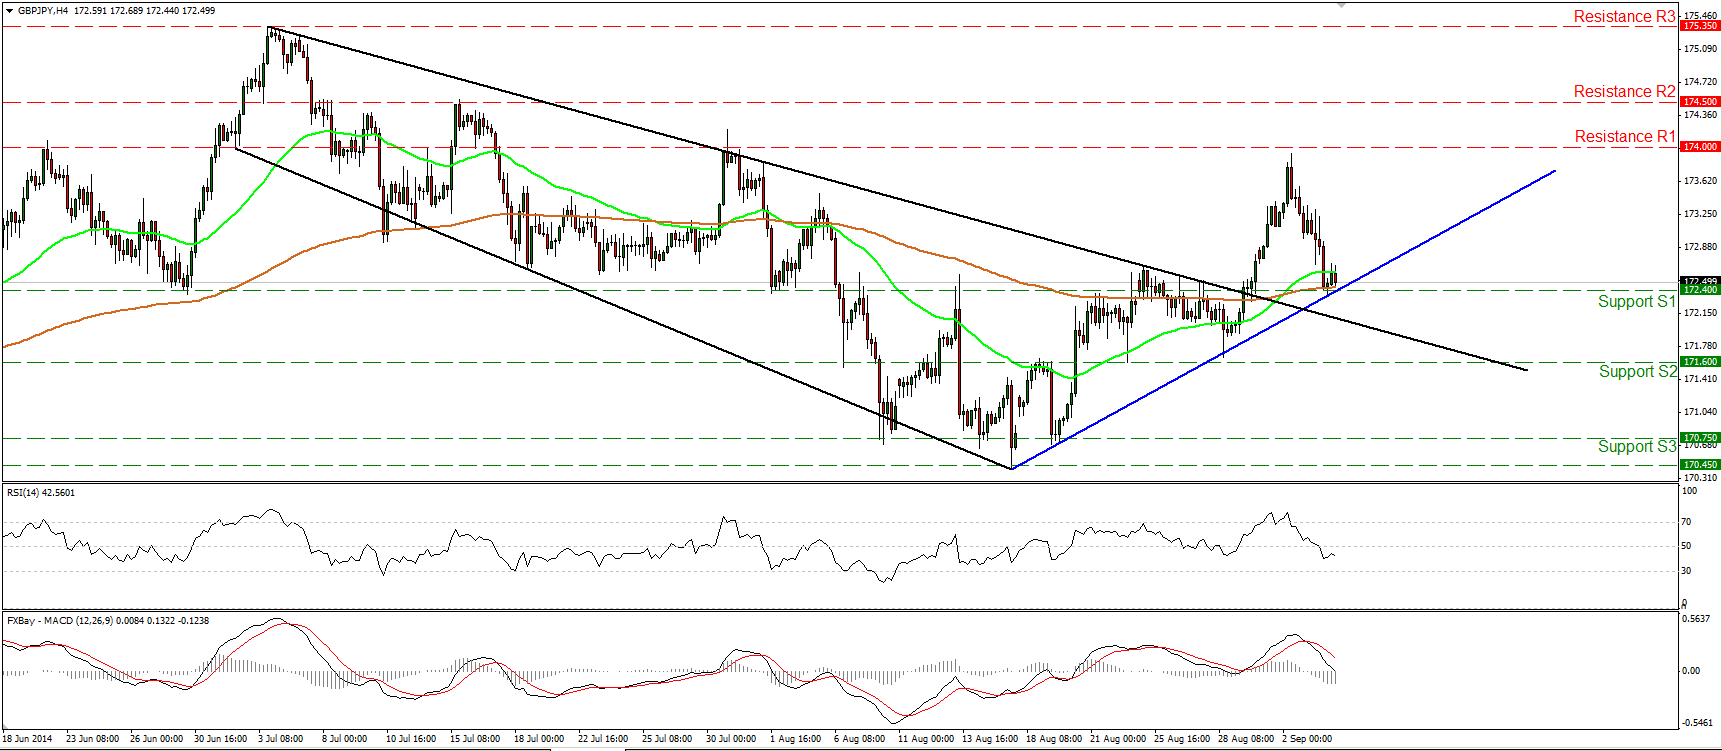
GBP/JPY tumbled yesterday after finding resistance slightly below the 174.00 (R1) line, but the decline was halted near the blue uptrend line. The structure remains higher highs and higher lows above that trend line and above the prior black downtrend line, and this keeps the short-term upside path intact. A rebound near the 172.40 zone is likely to confirm that and could have bullish implications, perhaps for another test near the 174.00 obstacle. However, on the daily chart, I see a possible shooting star candlestick, which suggest that the down wave might not have ended. Given our opposite technical signs, I would like to sit neutral until investors paint a clearer picture.
• Support: 172.40 (S1), 171.60 (S2), 170.75 (S3).
• Resistance: 174.00 (R1), 174.50 (R2), 175.35 (R3).
NZD/USD finds support at 0.8290
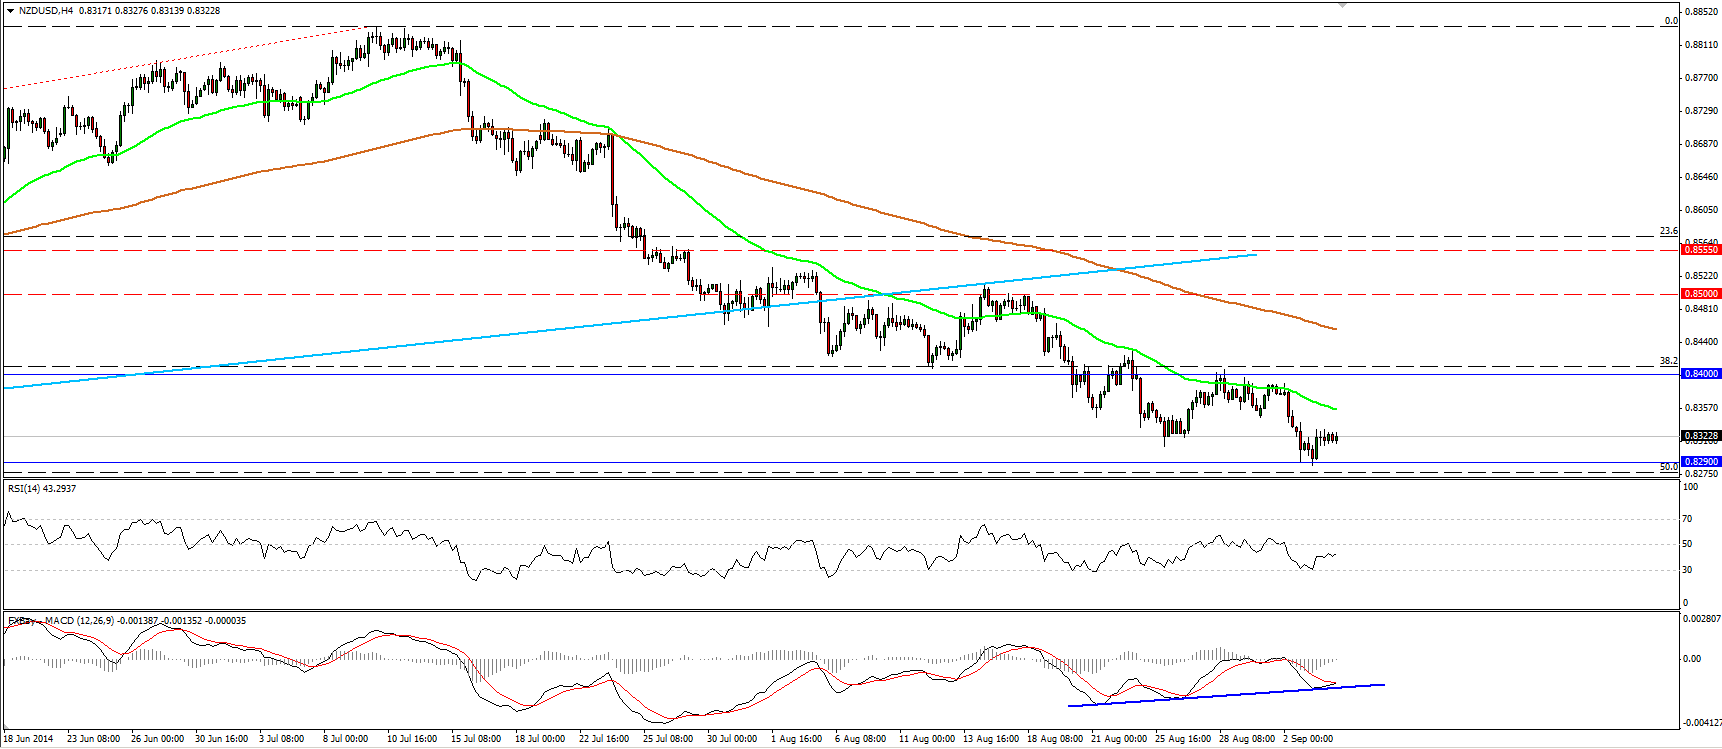
NZD/USD moved slightly higher after finding support at 0.8290 (S1), which lies marginally above the 50% retracement level of the 30th August 2013 – 11th July 2014 long-term uptrend. As long as the rate is trading below the long-term uptrend line, drawn from back the 30th of August 2013, I will stick to the view that the overall outlook remains to the downside. However, on the 4-hour chart I see positive divergence between the MACD and the price action, indicating decelerating downside momentum. Having that in mind and the fact that the rate is close to the 50% retracement line, I would be cautious of a corrective bounce before the bears pull the trigger again. I would wait for a move below 0.8290 (S1) to signal the downside continuation. Such a move is likely to target our next support line at 0.8240 (S2).
• Support: 0.8290 (S1), 0.8240 (S2), 0.8185 (S3).
• Resistance: 0.8400 (R1), 0.8500 (R2), 0.8555 (R3).
Gold in a retracing mode
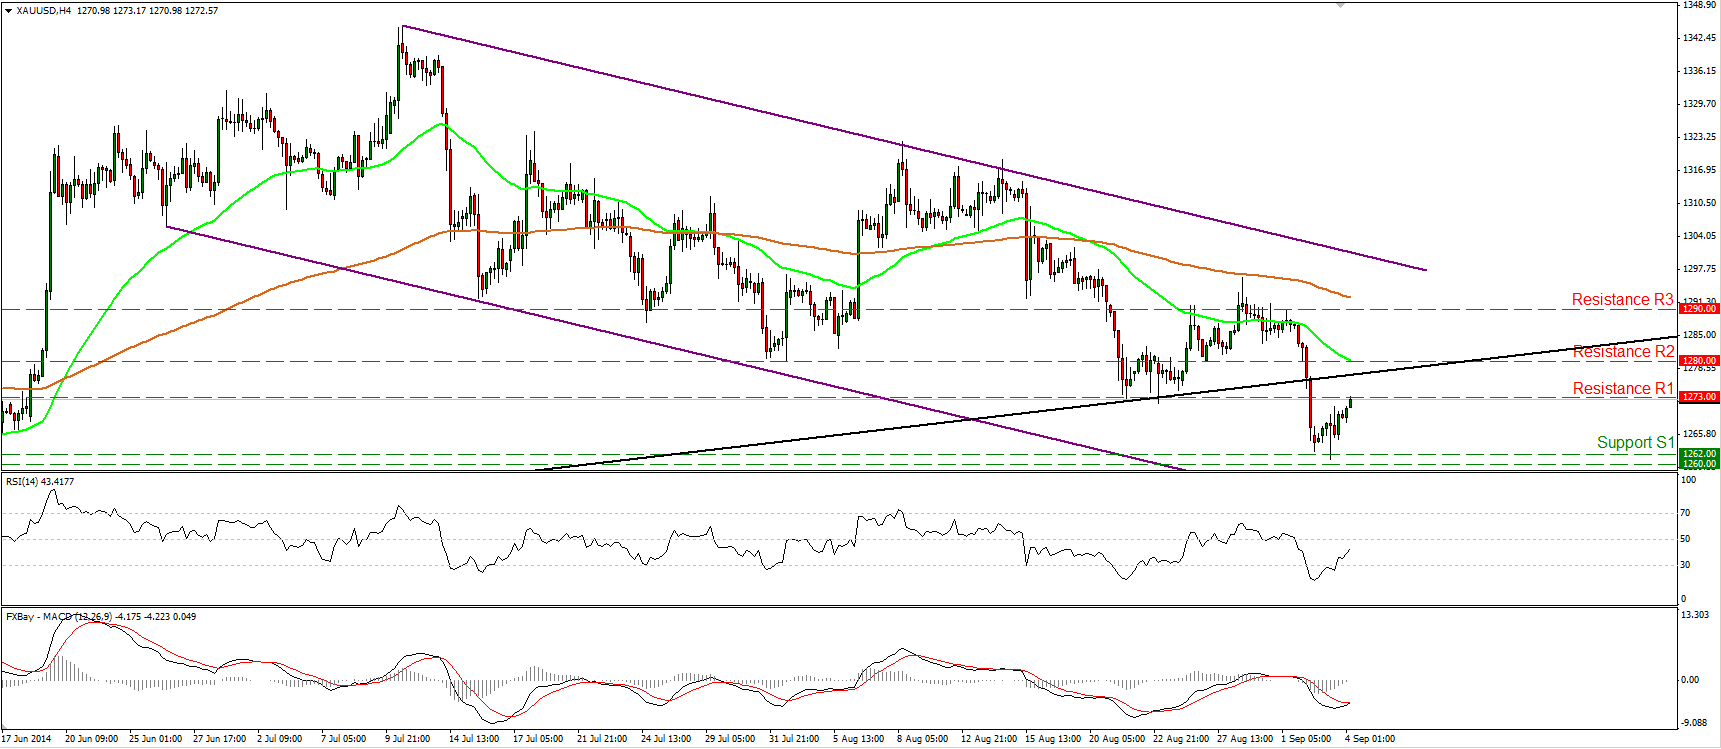
Gold moved higher on Wednesday and today at the European opening is testing the 1273 (R1) line as a resistance this time. Taking into account that the metal is trading within the purple downside channel and below the black long-term support line (drawn from back at the low of the 30th of December), I still see a negative overall outlook. As a result, I would consider the recent up wave as a corrective move before sellers take the reins again. Looking on our momentum studies, the RSI exited oversold conditions and is pointing up, while the MACD appears ready to move above its trigger line, thus I would be cautious that the up retracement may continue above 1273 (R1), perhaps towards 1280 (R2).
• Support: 1262 (S1), 1250 (S2), 1240 (S3).
• Resistance: 1273 (R1), 1280 (R2), 1290 (R3).
WTI rebounds from 92.60
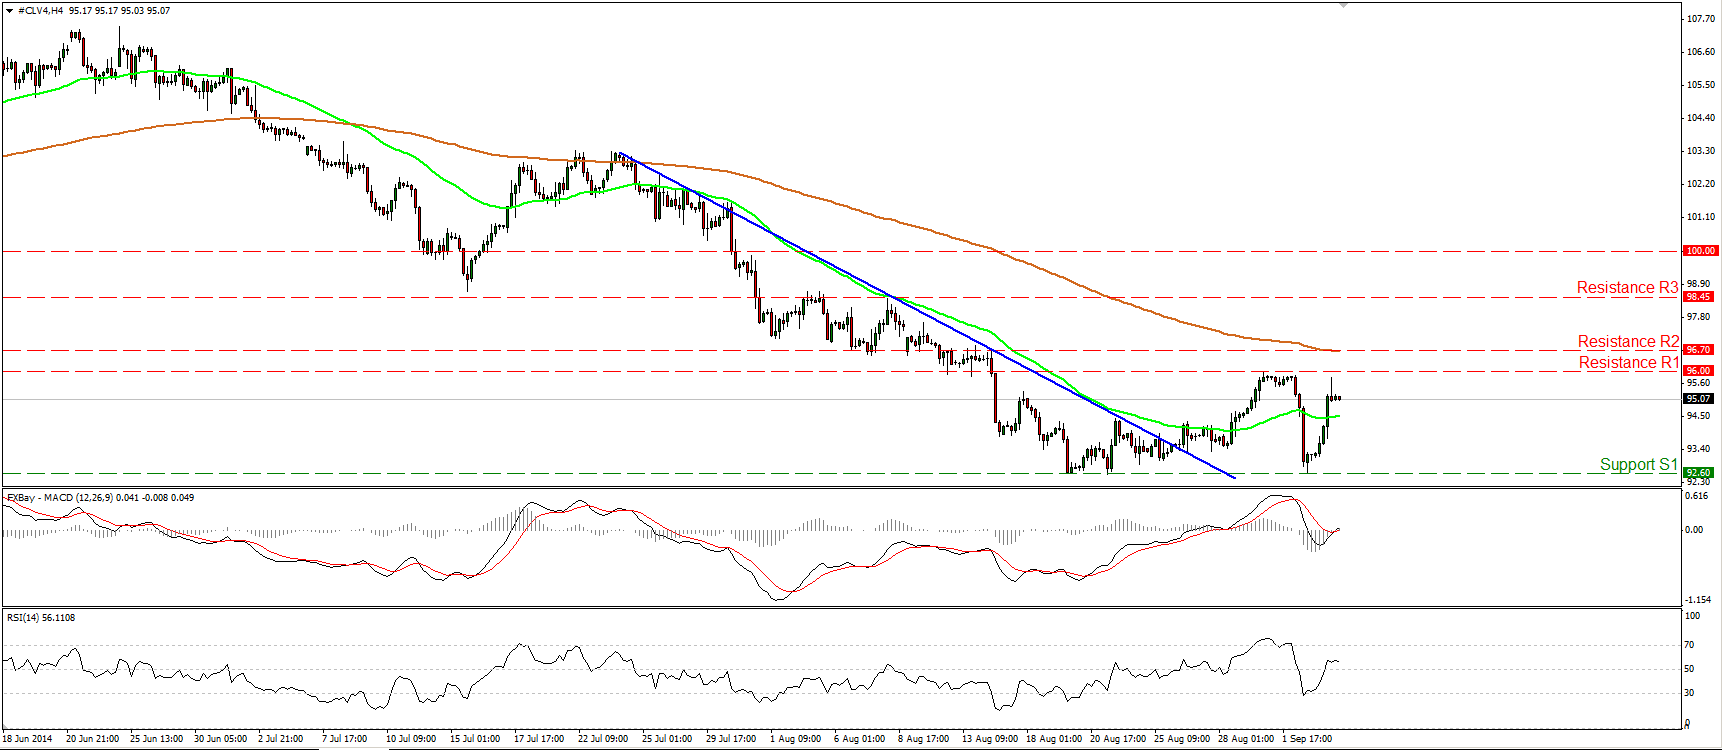
WTI rebounded strongly from the key support of 92.60 (S1), defined by the lows of the 19th and the 21st of August. This confirms the strength of that line and validates my view to remain neutral yesterday despite the sharp plunge. Now the price is trading back marginally below the 96.00 line. I will stay neutral still, since I would like to see a move above 96.70 (R2) to shift my attention to the upside. Such a move would confirm a forthcoming higher high and is likely to target the 98.45 (R3) barrier. Moving on the daily chart, although negative, both my daily momentum studies are in a rising mode, increasing the likelihood for the aforementioned upside break.
• Support: 92.60 (S1), 91.60 (S2), 90.00 (S3).
• Resistance: 96.00 (R1), 96.70 (R2), 98.45 (R3).
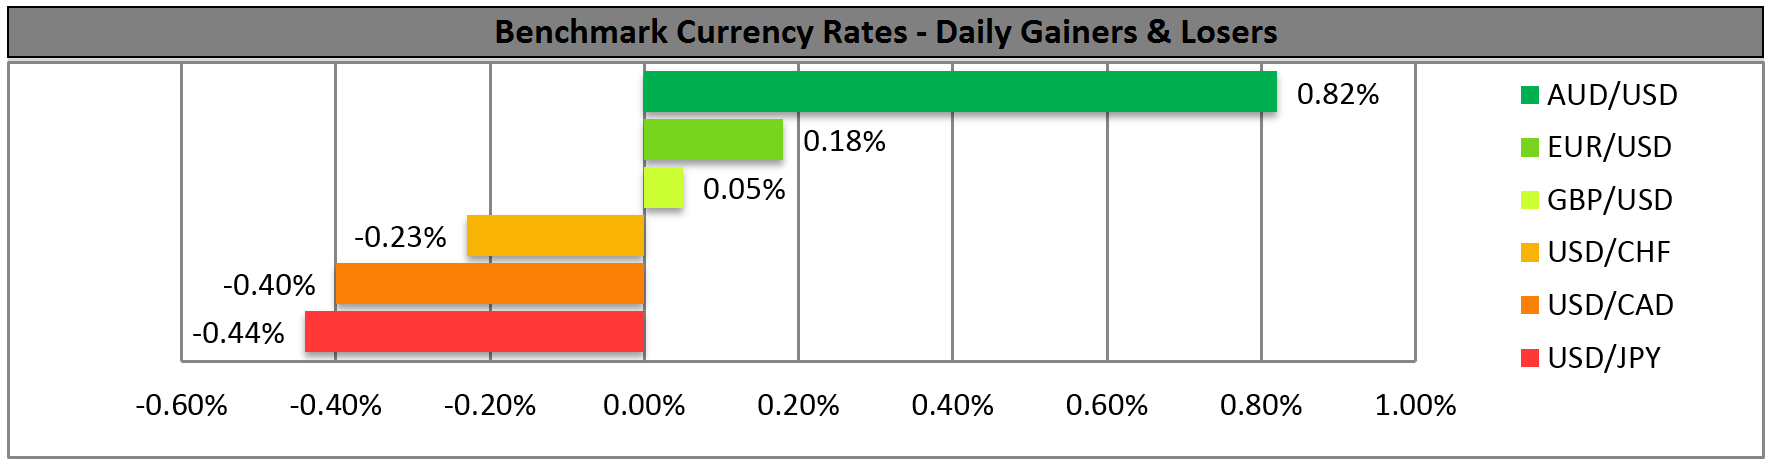
BENCHMARK CURRENCY RATES - DAILY GAINERS AND LOSERS
MARKETS SUMMARY