EUR/USD back above 1.3400
EUR/USD advanced on Friday, violating the upper boundary of the near-term purple downside channel and moving back above 1.3400 (S1). However, the advance was halted by our resistance level of 1.3445 (R1), which coincides with the 23.6% retracement level of the 1st – 30th July decline. Although we may experience the continuation of the upside wave, the overall outlook remains to the downside in my view, since in the bigger picture, the rate is printing lower peaks and lower troughs within the blue downside channel, connecting the lows and the highs on the daily chart. The 14-day RSI exited oversold conditions, while the daily MACD shows signs of bottoming and could move above its trigger line in the near future, corroborating my view that we cannot rule out the continuation of the retracement, perhaps for a test near the psychological zone of 1.3500 (R2) as a resistance this time.
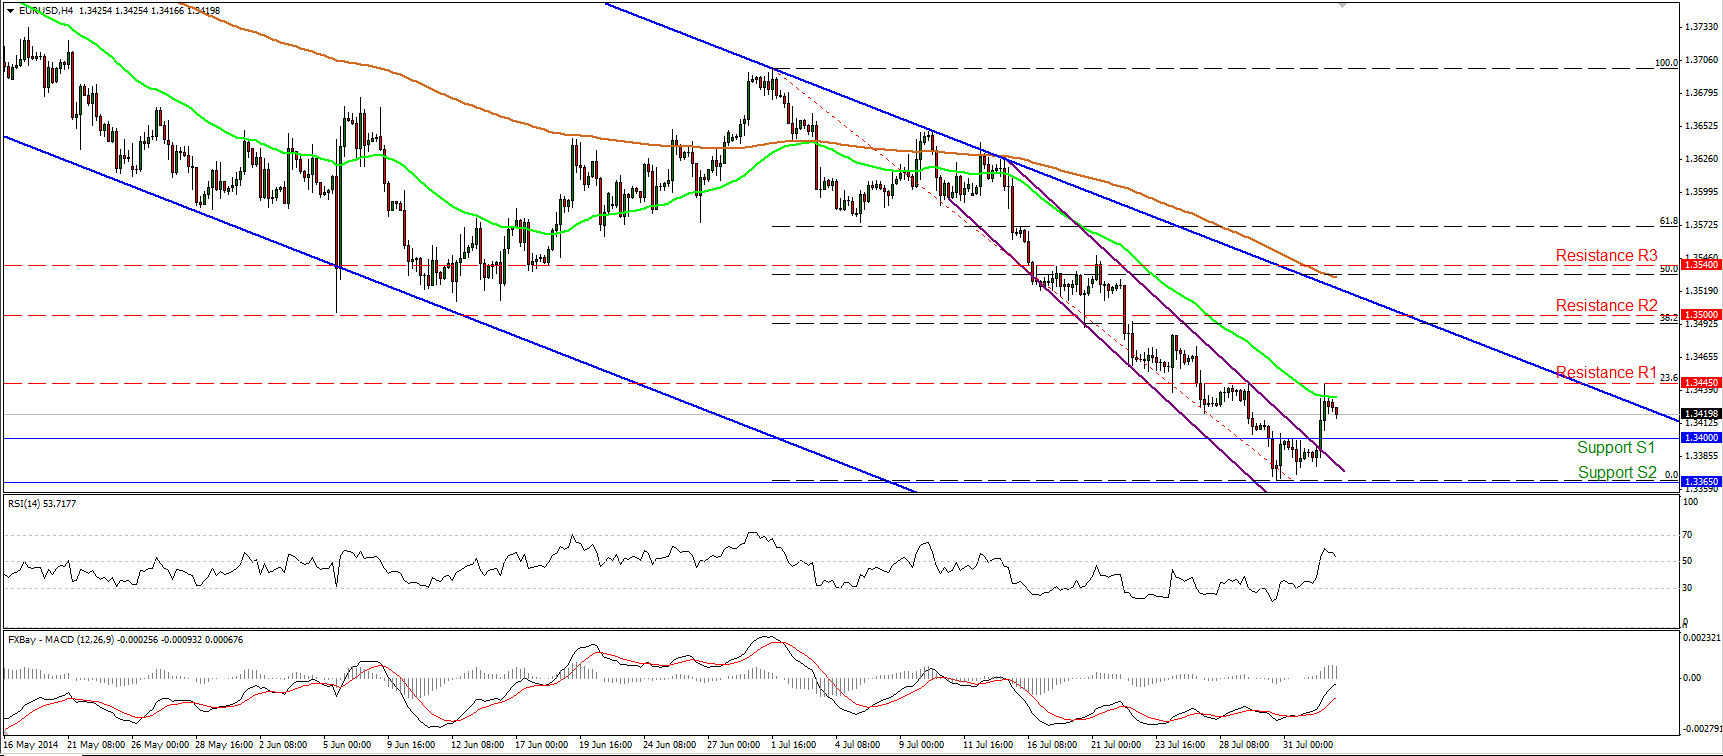
• Support: 1.3400 (S1), 1.3365 (S2), 1.3350 (S3)
• Resistance: 1.3445 (R1), 1.3500 (R2), 1.3540 (R3)
EUR/JPY remains below the 200-period EMA
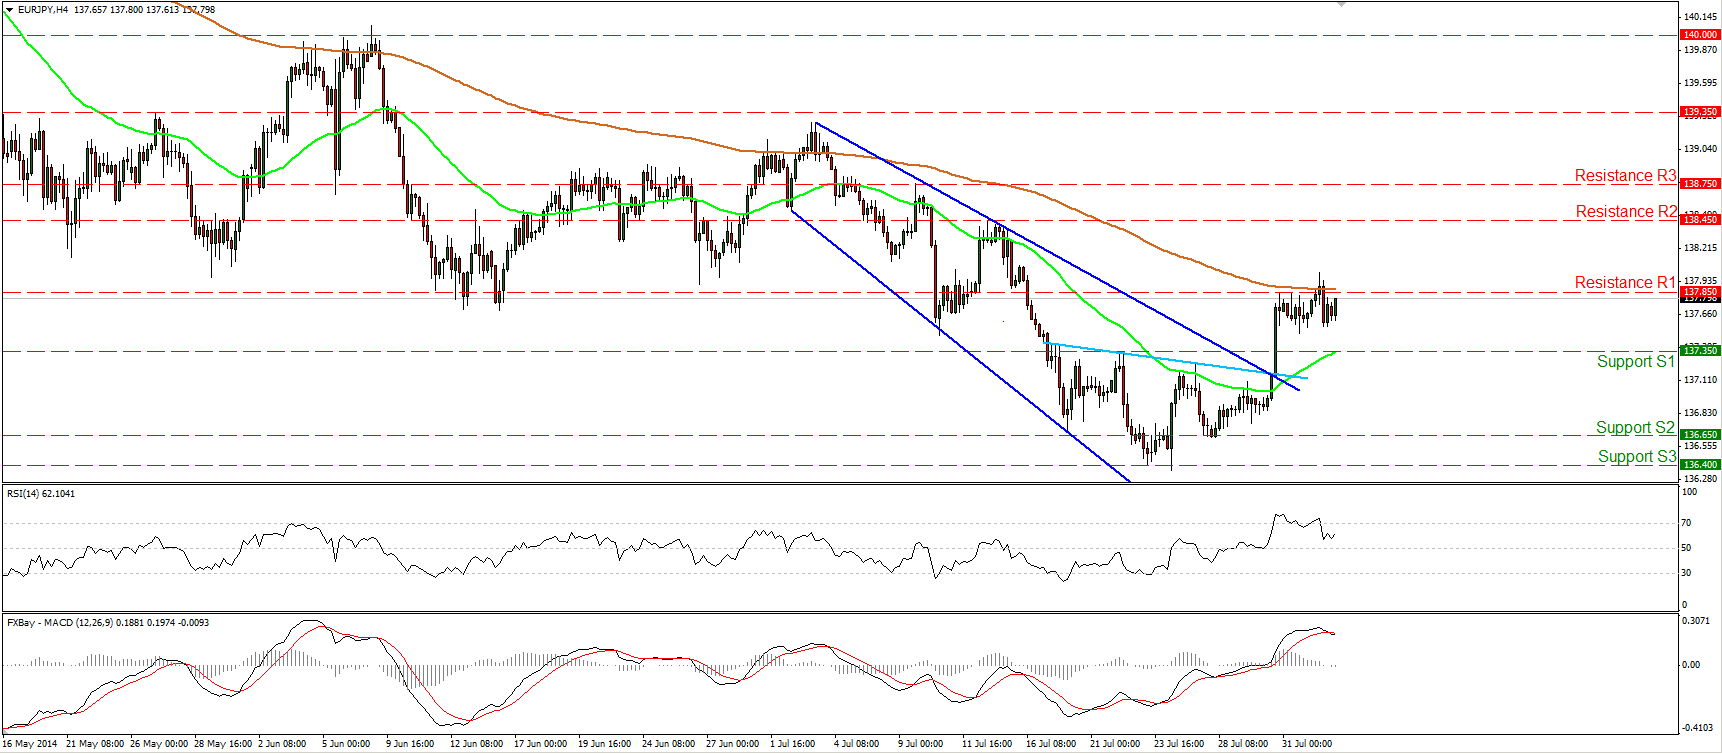
EUR/JPY moved in a consolidative mode, remaining below the resistance bar of 137.85 (R1) and the 200-period moving average. The short-term outlook remains to the upside in my view and a move above 137.85 (R1) is likely to drive the battle towards the next resistance at 138.45 (R2). On the daily chart, the 14-day RSI moved above its 50 line, while the daily MACD crossed above its signal line and is currently heading towards its zero line, keeping the near-term momentum to the upside. The rate lies near the 200-day moving average and a bullish cross in the near future would add to the positive picture of the EUR/JPY currency pair.
• Support: 137.35 (S1), 136.65 (S2), 136.40 (S3)
• Resistance: 137.85 (R1), 138.45 (R2), 138.75 (R3)
GBP/USD breaks below the 80-day EMA
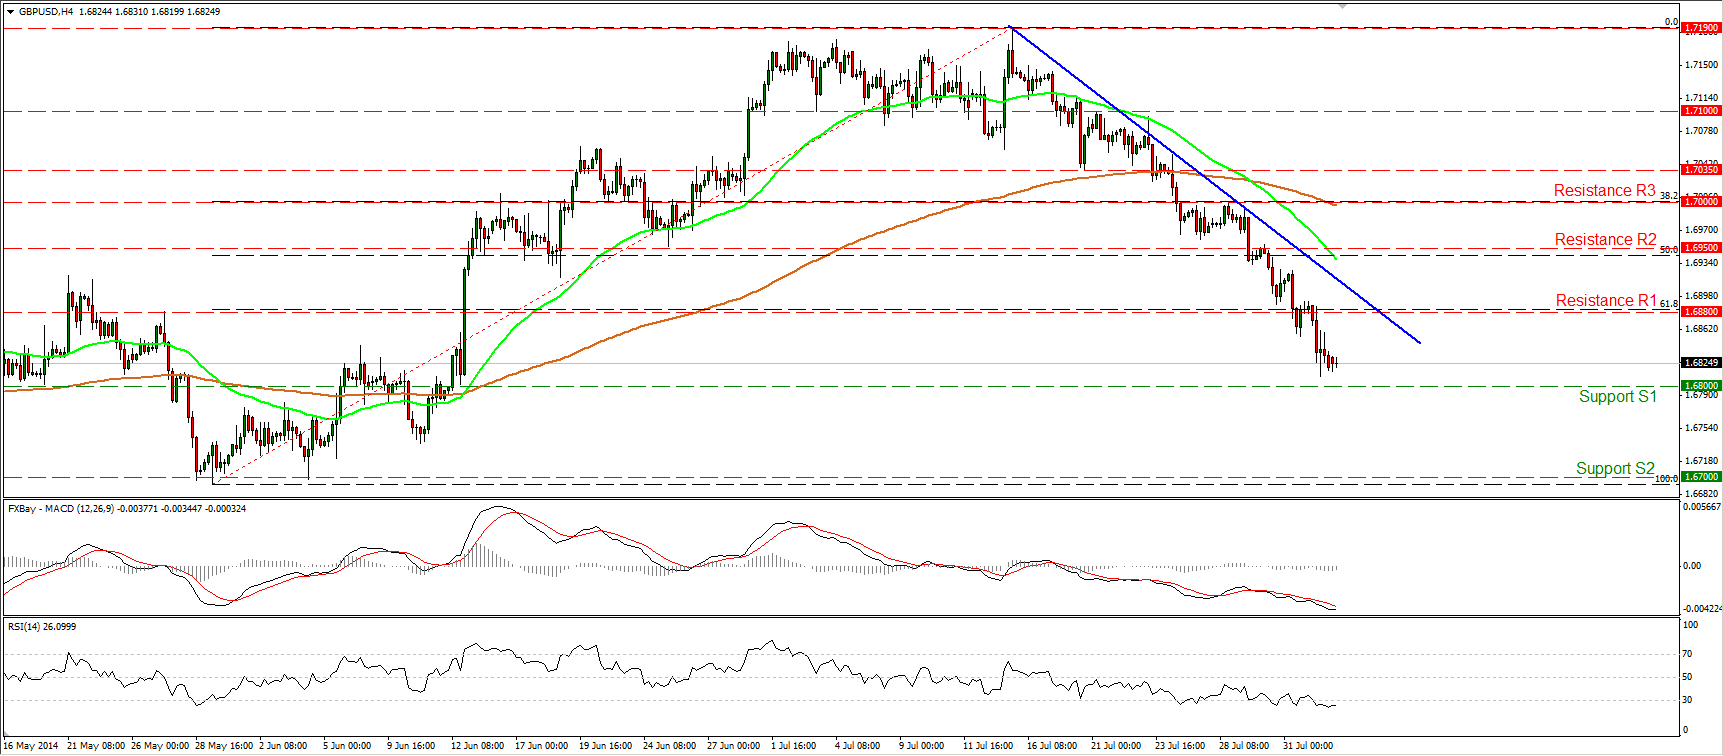
GBP/USD continued falling, moving below the 1.6880 barrier, which coincides with the 61.8% retracement level of the 29th May – 15th of July advance. At the time of writing, the rate is trading slightly above our support of 1.6800 (S1), where a clear dip could carry larger bearish implications and could open the way towards the next support hurdle, at 1.6700 (S2). As long as the rate is printing lower highs and lower lows below the blue downtrend line and below both the moving averages the short-term bias remains to the downside. In the bigger picture, Cable broke below the 80-day exponential moving average for the first time after a whole year, increasing the possibilities for further declines, at least towards the 1.6700 zone.
• Support: 1.6800 (S1), 1.6700 (S2), 1.6650 (S3)
• Resistance: 1.6880 (R1), 1.6950 (R2), 1.7000 (R3)
Gold rebounds from 1280
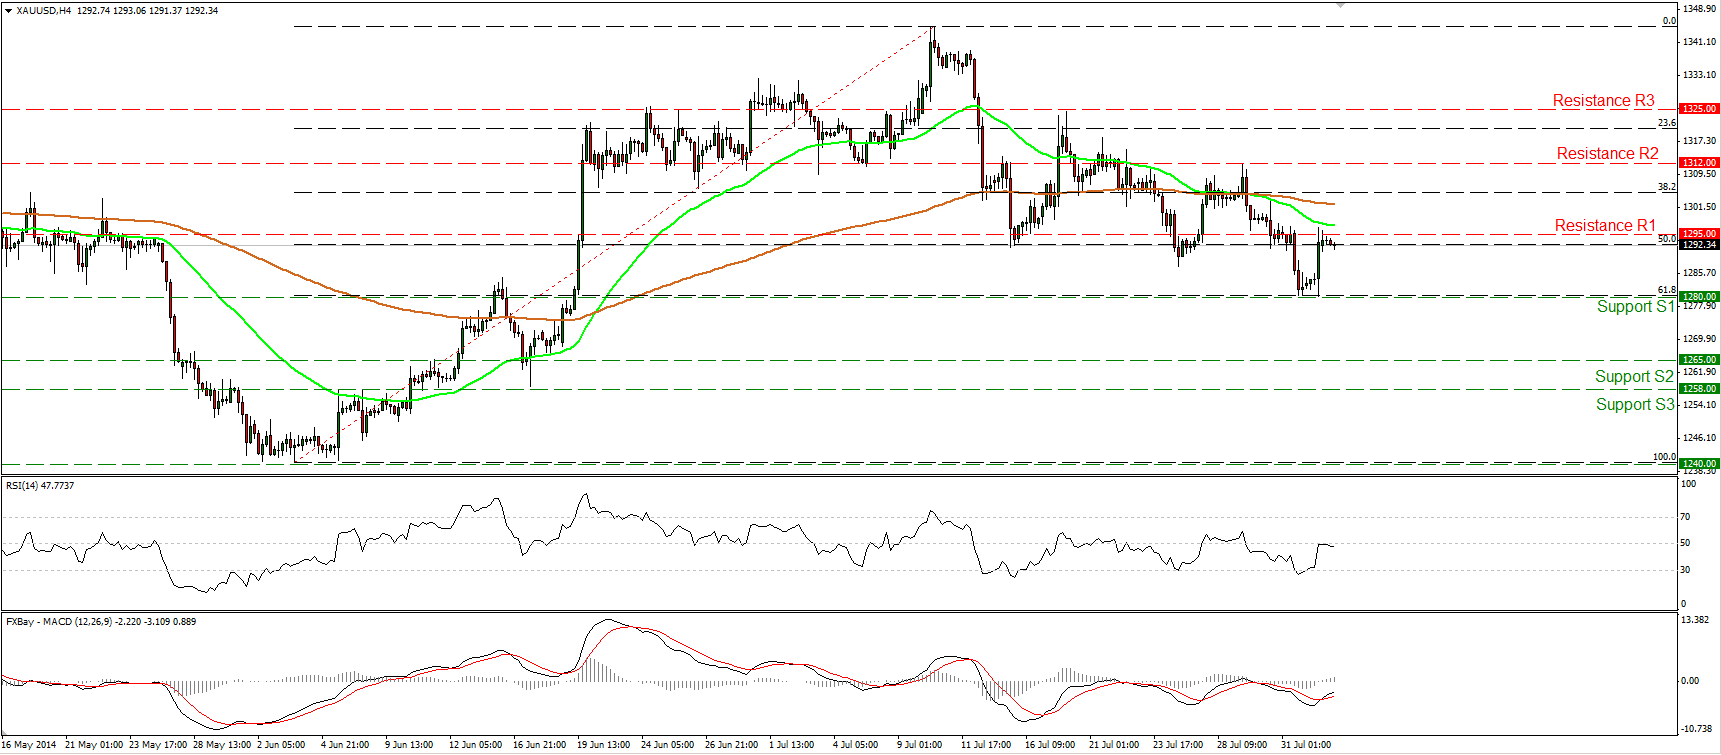
Gold rebounded strongly on Friday after finding support at the 61.8% retracement level of the 3rd June – 10th July uptrend, at 1280 (S1). The advance was halted by 1295 (R1), slightly below the 50-period moving average. The RSI hit its 50 line and moved somewhat lower, while the MACD, lies above its trigger line. Although the price structure remains lower lows and lower highs, bearing in mind the mixed momentum signs, I would prefer to remain to the sidelines for now. Moreover, on the daily chart, both the 50-day and the 200-day moving averages are pointing sideways, giving me another reason to remain flat. A decisive dip below the 1280 (S1) barrier is needed to signal further declines and could probably target the next support zone at 1265 (S2), while a move above the high of 1312 (R2) could be a sign that the 10th- 31st July decline was just a 61.8% correction of the 3rd June – 10th July uptrend.
• Support: 1280 (S1), 1265 (S2), 1258 (S3)
• Resistance: 1295 (R1), 1312 (R2), 1325 (R3)
WTI finds support near 97.00
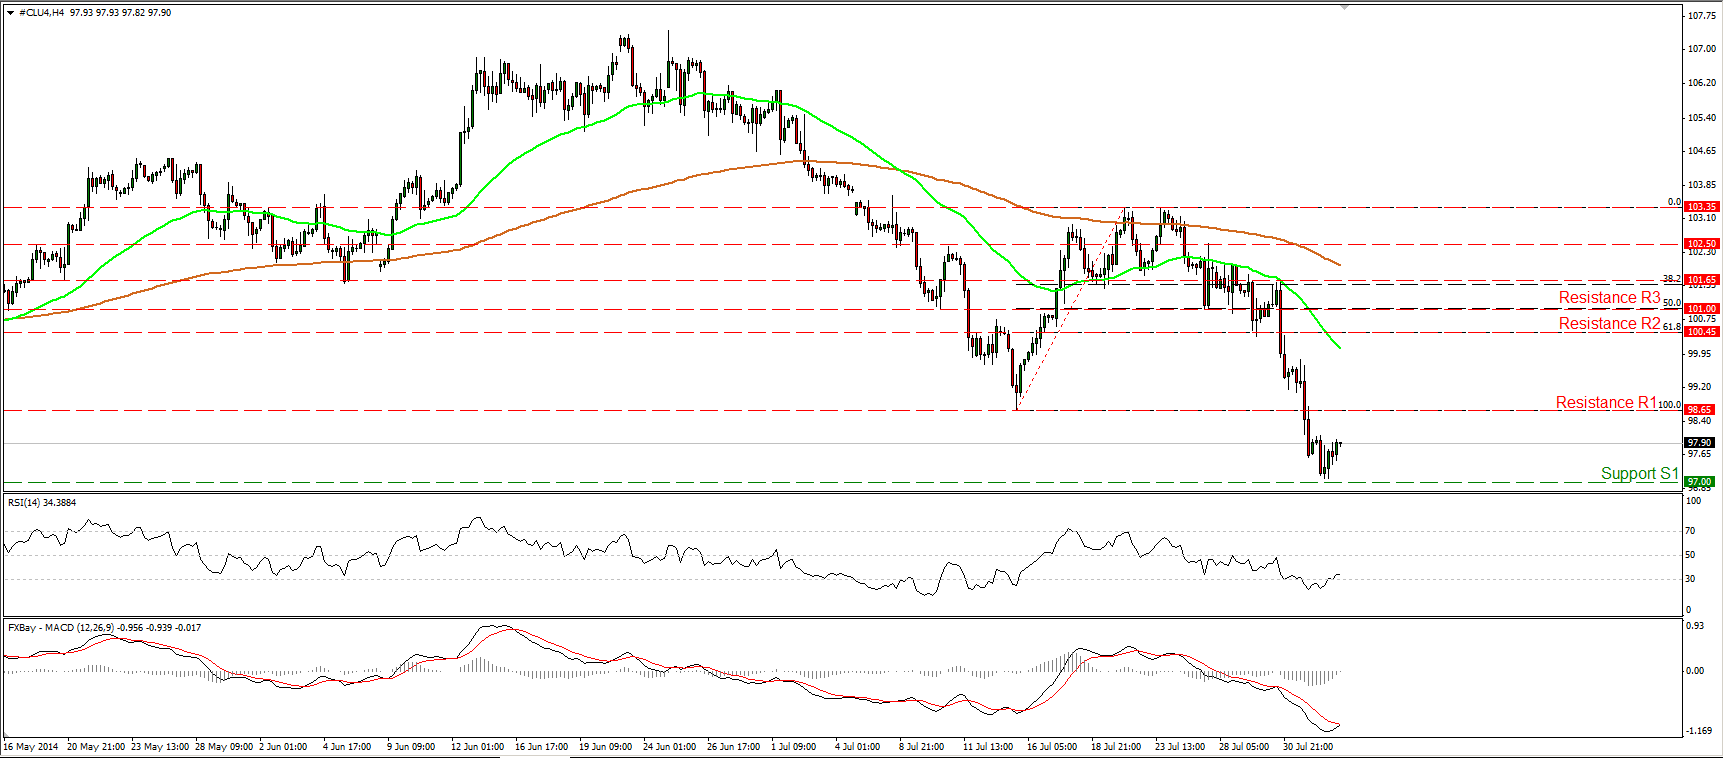
WTI declined somewhat but found support slightly above 97.00 (S1) and rebounded. This confirms my view that is better to wait for a dip below 97.00 (S1) before expecting the continuation of the downtrend. Such a dip could pave the way towards the zone of 95.85 (S2), which coincides with the 161.8% extension level of the 15th – 23rd July upside wave. Nevertheless, considering our momentum signs, I would wait for further retracement before the sellers prevail again, perhaps a test near the resistance of 98.65 (R1). The RSI left its oversold field, while the MACD has bottomed and at the time of writing is testing its signal line. Zooming on the 1-hour chart, I see that our hourly momentum studies also support the continuation of the correction. The 14-hour RSI moved above its 50 line, while the hourly MACD, already above its signal line, is pointing up and is approaching its zero line.
• Support: 97.00 (S1), 95.85 (S2), 94.00 (S3)
• Resistance: 98.65 (R1), 100.45 (R2), 101.00 (R3)
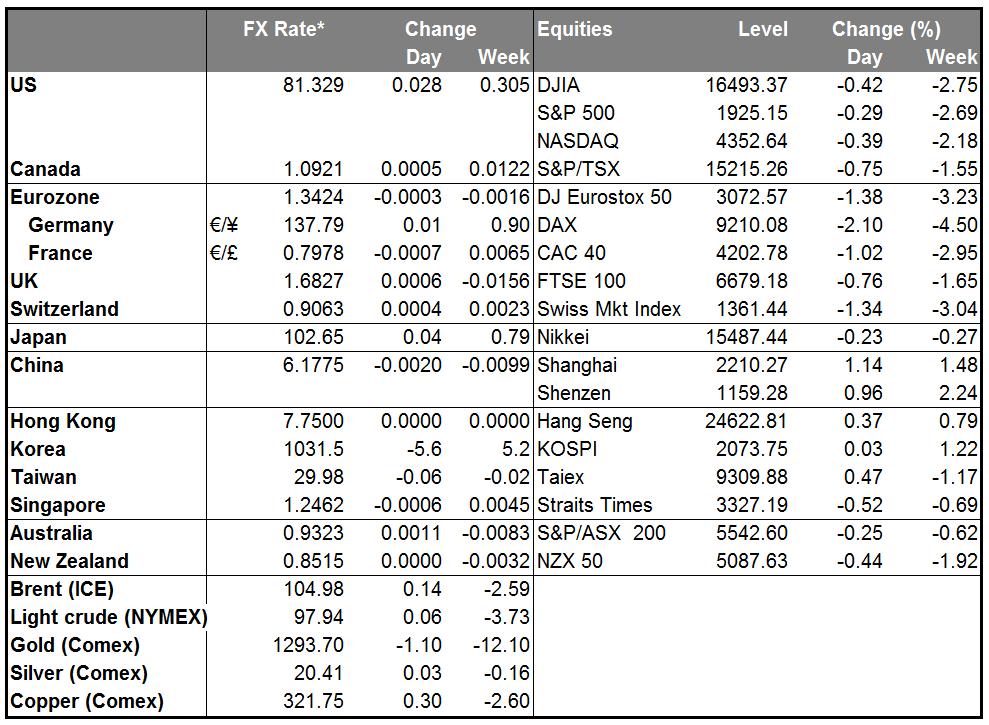
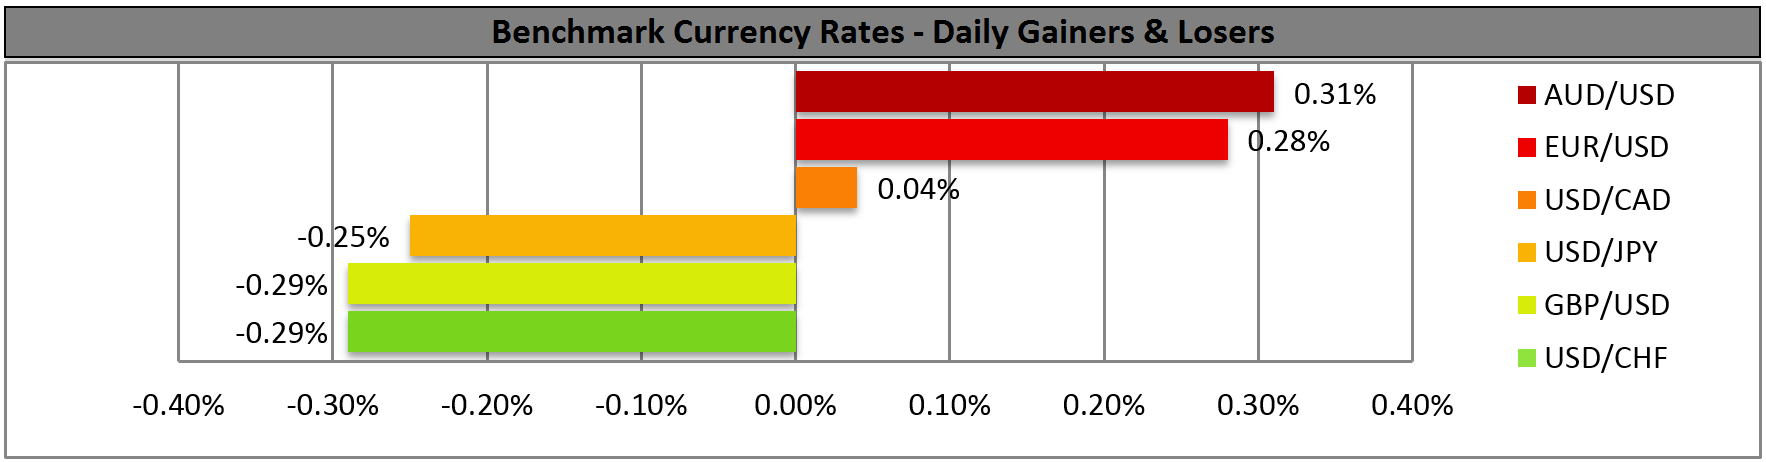
BENCHMARK CURRENCY RATES - DAILY GAINERS AND LOSERS
MARKETS SUMMARY