EUR/USD dips below 1.2500
EUR/USD continued its plummet on Friday, reaching and falling below the psychological line of 1.2500, which happens to be the 76.4% retracement level of the July 2012- May 2014 major advance. Today, during the Asian morning, the pair found support at 1.2435 (S1). A dip below that line could challenge our next support of 1.2400 (S2). In my view, a clear break of the latter level is the move that could trigger another strong leg down, perhaps towards the 1.2300 (S3) area, defined by the low of the 20th of August 2012. As for the bigger picture, the dip below the critical line of 1.2500 (R1) confirmed a forthcoming lower low on the daily chart and signaled the continuation of the longer-term downtrend.

• Support: 1.2435 (S1), 1.2400 (S2), 1.2300 (S3).
• Resistance: 1.2500 (R1), 1.2635 (R2), 1.2700 (R3).
USD/JPY breaks above the psychological line of 110.00
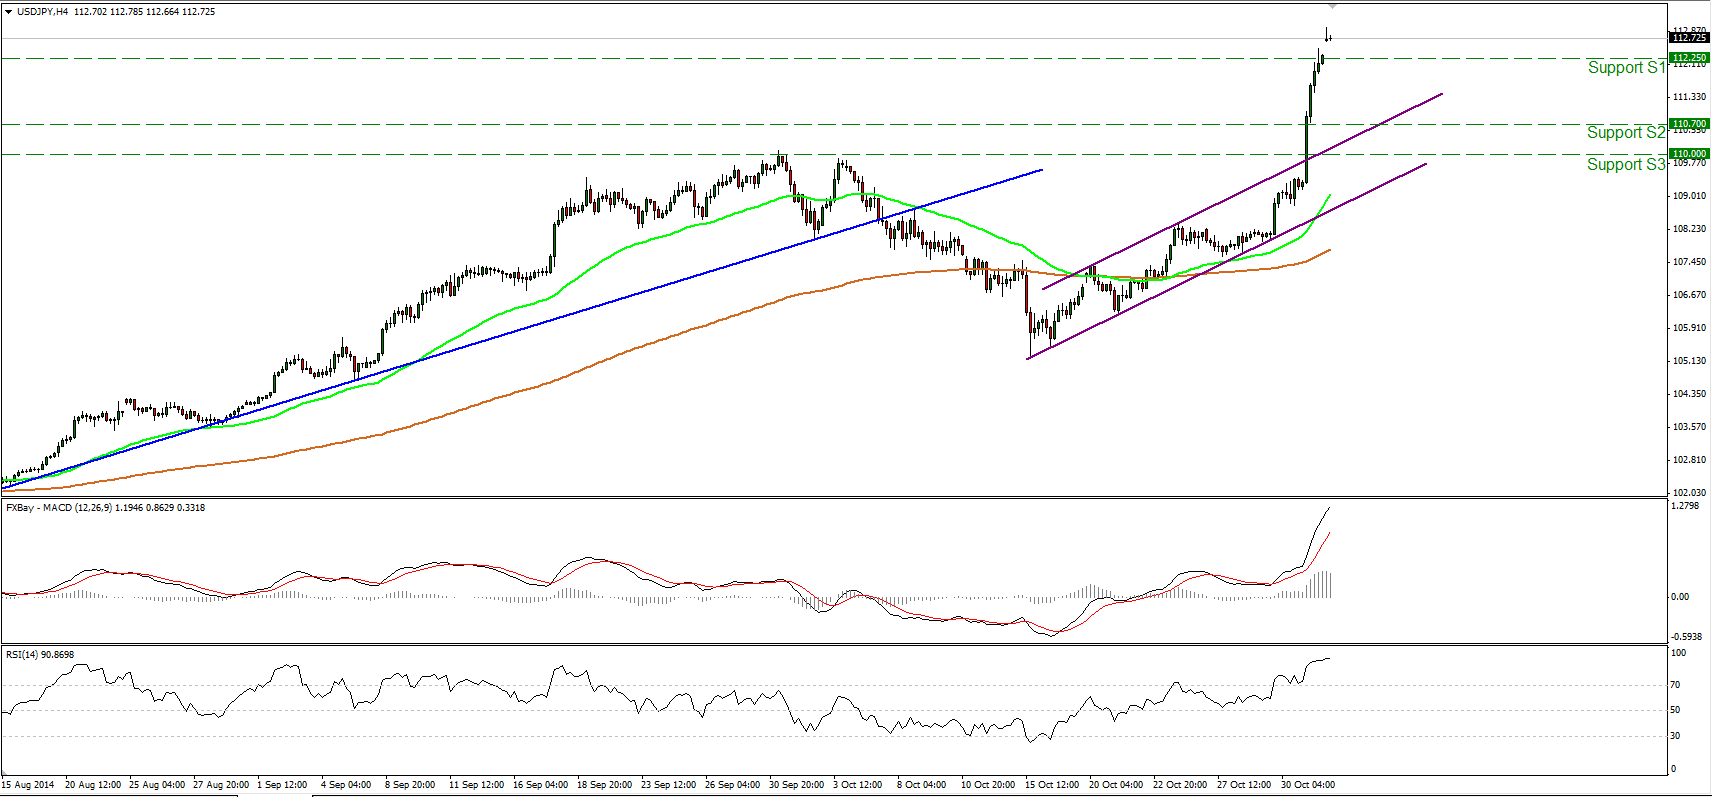
USD/JPY surged after the Bank of Japan expanded its monetary stimulus, breaking above the psychological zone of 110.00. The pair gapped higher today, confirming that the short-term bias is still positive. In my view, the bulls could continue driving the pair higher, probably towards the highs of December 2007, at 114.60 (R1) at first stage. On the daily chart, the rally above 110.00 (S3) confirmed a forthcoming higher peak, something that keeps the overall path of USD/JPY to the upside. Furthermore, the daily MACD rebounded from marginally below zero, turned positive, and crossed above its signal line, while the 14-day RSI surged above its 70 line and is still pointing up. This designates accelerating bullish momentum in my view and magnifies the case for further advances.
• Support: 112.25 (S1), 110.70 (S2), 110.00 (S3).
• Resistance: 114. 60 (R1), 115.00 (R2), 116.00 (R3).
GBP/USD in a consolidative mode
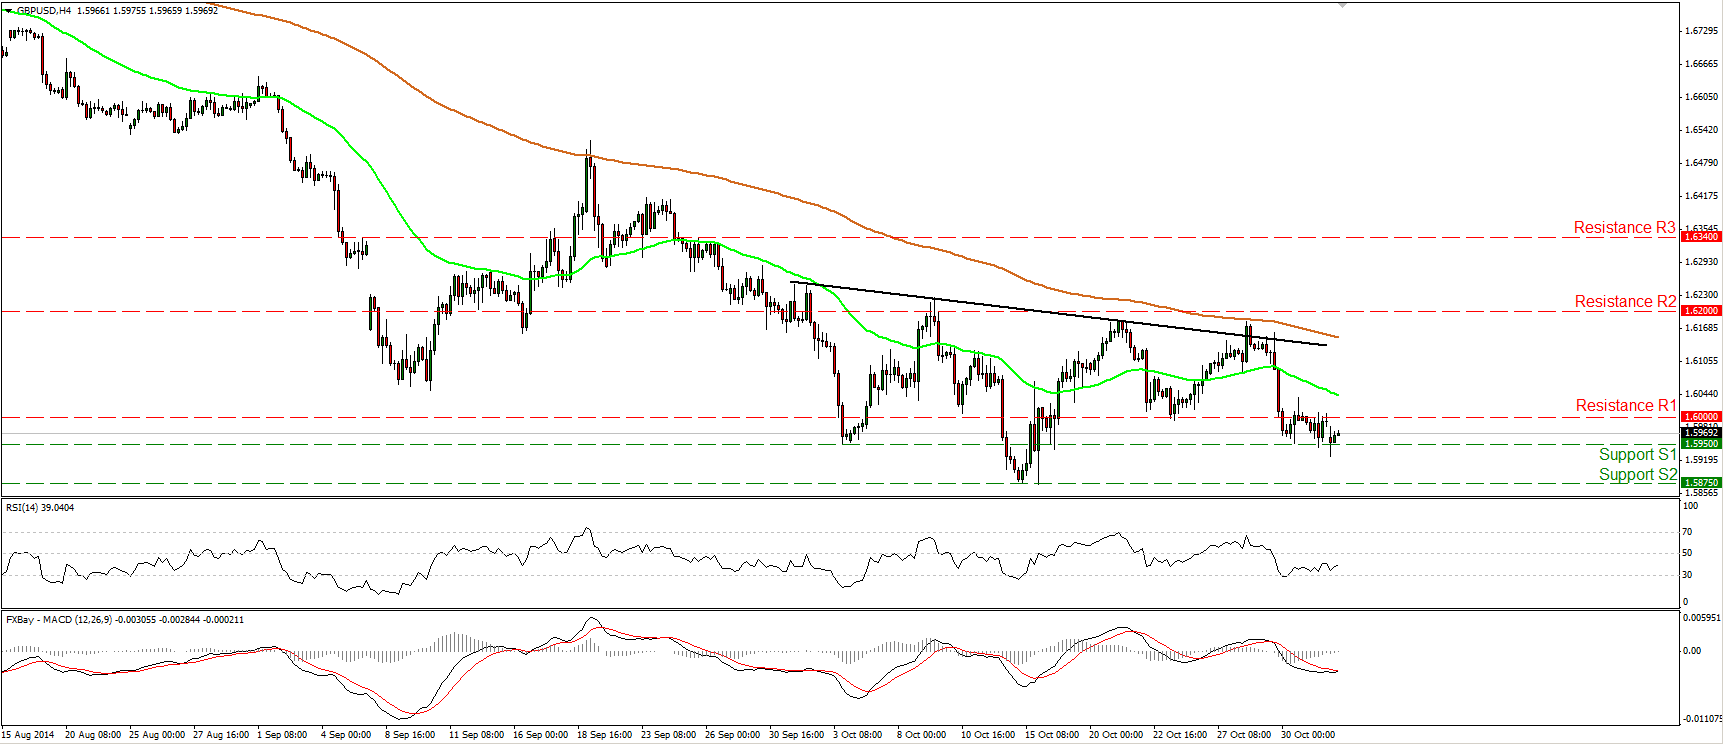
GBP/USD moved in a consolidative manner, staying near the support barrier of 1.5950 (S1). A break below that line could target the low of the 15th of October at 1.5875 (S2). However, bearing in mind our momentum signs I would prefer to take the sidelines as far as the short-term picture is concerned. The RSI moved somewhat higher after finding support at its 30 line, while the MACD, although negative, shows signs of bottoming and could cross above its signal line any time soon. As for the broader trend, I will maintain the view that as long as Cable is trading below the 80-day exponential moving average, the overall path remains negative. But I would prefer to see a break below 1.5875 before getting again confident on the downside. Such a dip would signal a forthcoming lower low on the daily chart and could trigger extensions towards the resistance-turned-into support barrier of 1.5720 (S3), defined by the high of the 21st of August 2013. Moreover, I still see positive divergence between our daily oscillators and the price action. This confirms my view to wait for a move below 1. 5875 (S2) to signal the continuation of the down path.
• Support: 1.5950 (S1), 1.5875 (S2), 1.5720 (S3).
• Resistance: 1.6000 (R1), 1.6200 (R2), 1.6340 (R3).
Gold breaks below the strong barrier of 1180
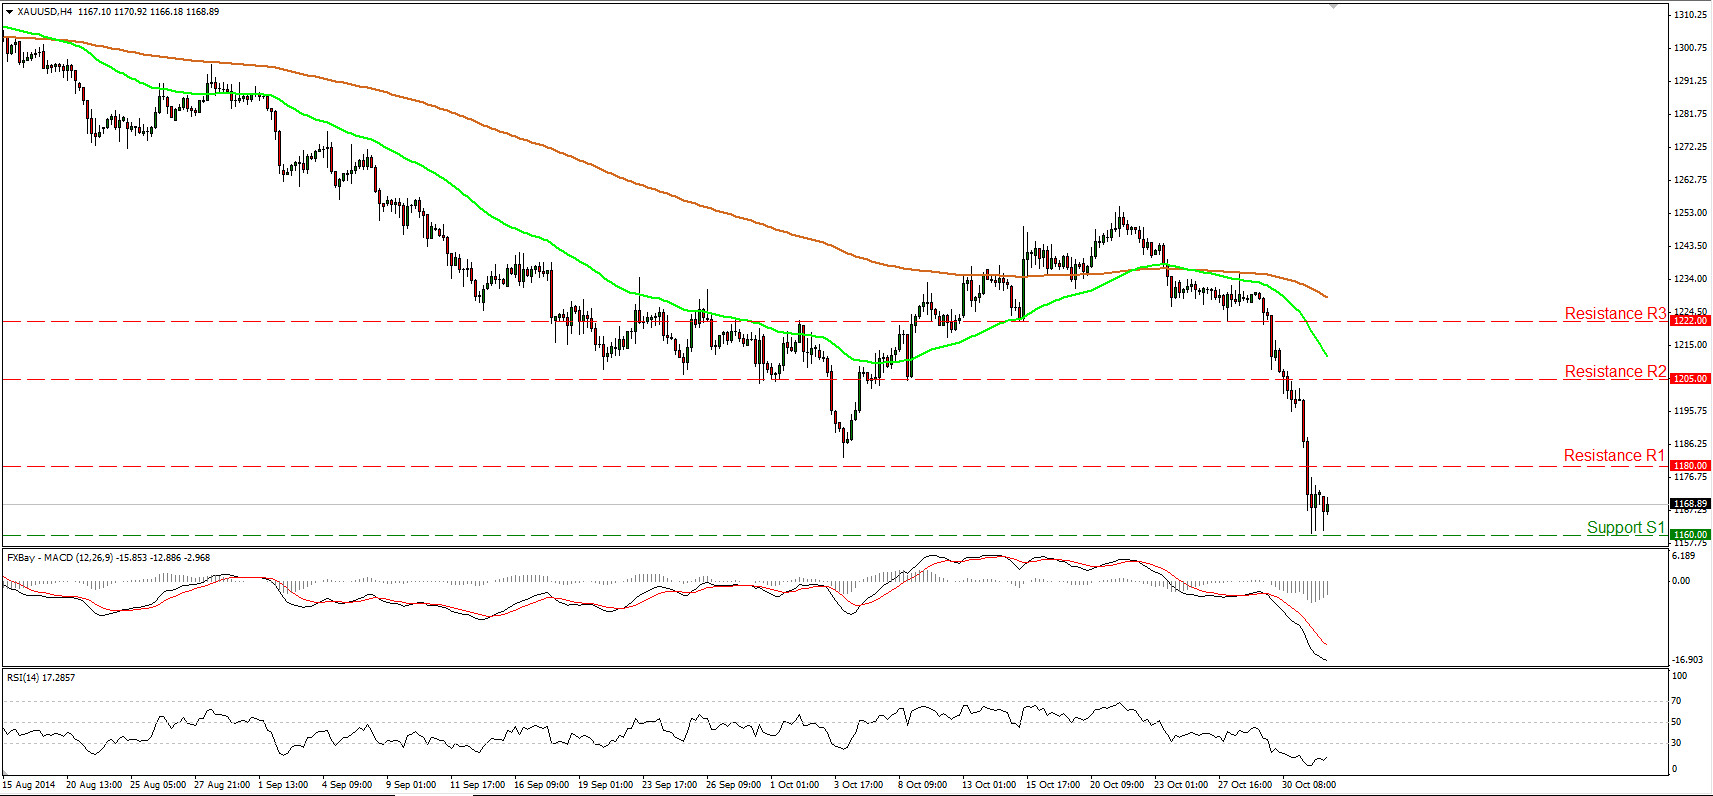
Gold continued falling on Friday, reaching and breaking below the key area of 1180 (R1). It is worth noting that the last time we saw the precious metal trading below that level was back in July 2010. However, the decline was halted marginally above 1160 (S1), which coincides with the 61.8% retracement level of the October 2008 - September 2011 advance. In my view, the dip below 1180 (R1) strengthens the likelihood that the price could go even lower. A clear violation of the 1160 (S1) barrier could set the stage for extensions towards the low of the 19th of April 2010, at 1125 (S2). Our daily momentum studies support the notion. The 14-day RSI dipped below its 30 line and is pointing down, while the daily MACD lies below both its zero and signal lines, confirming the recent strong negative momentum. However, back on the 4-hour chart, I see that the RSI lies within its oversold territory and could move above its 30 line in the close future. Hence, I would be watchful of a possible upside corrective wave before the bears pull the trigger again.
• Support: 1160 (S1), 1125 (S2), 1100 (S3).
• Resistance: 1180 (R1), 1205 (R2), 1222 (R3).
WTI still trendless
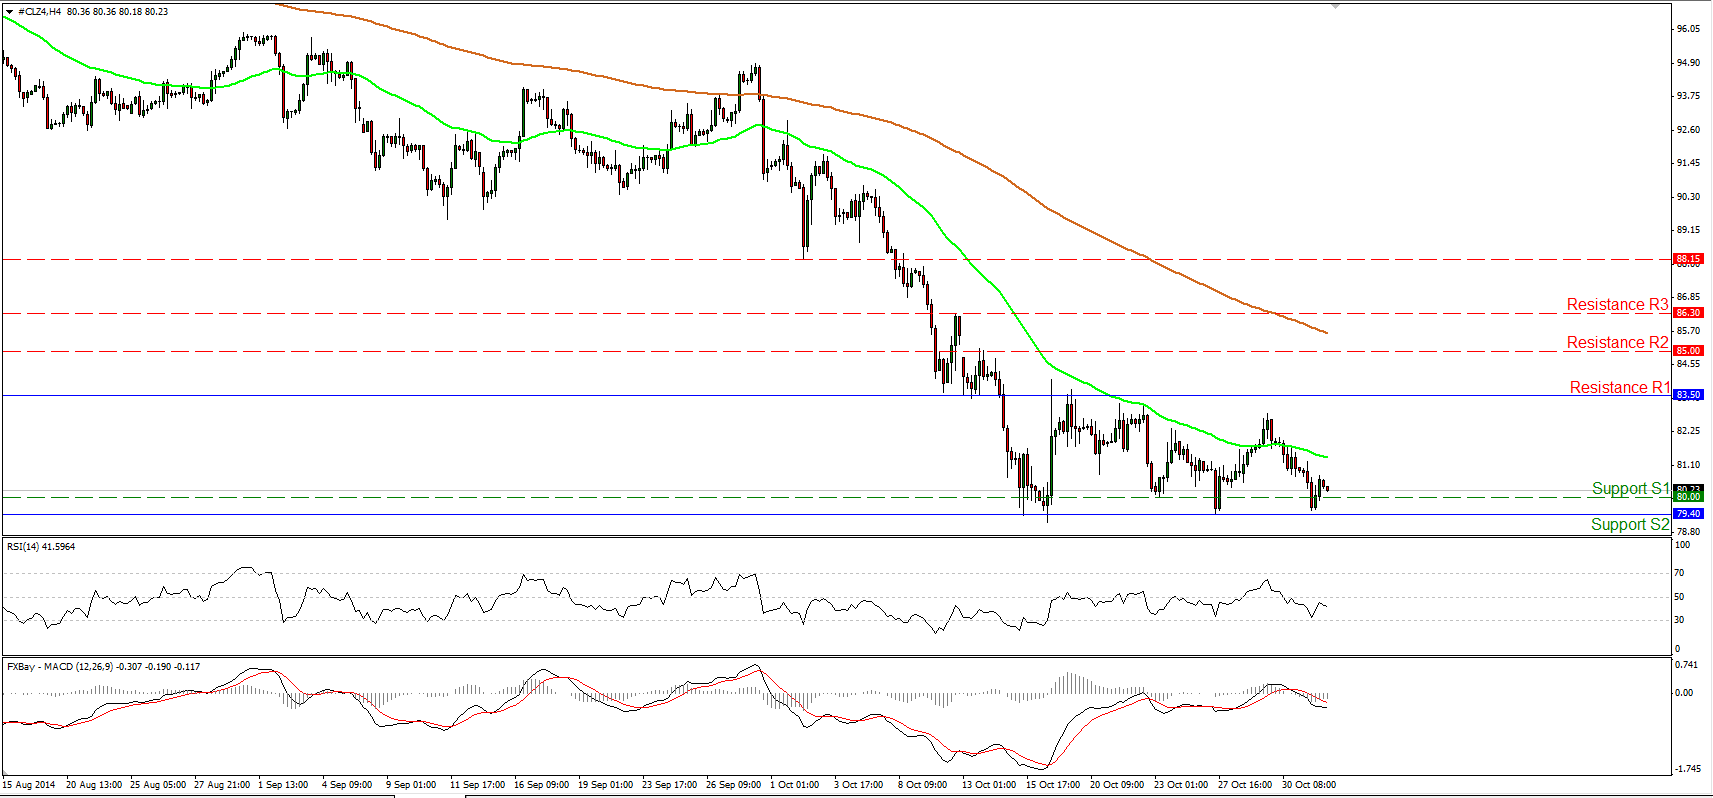
WTI declined on Friday, but found support slightly above the 79.40 (S2) barrier. As long as WTI is trading between that support obstacle and the resistance line of 83.50 (R1), I would maintain my flat approach. I still prefer to see a dip below 79.40 (S2), before getting again confident on the downside. On the other hand, a move above 83.50 (R1) is needed to flip the short-term outlook positive in my view. In the bigger picture, although I still see a downtrend structure, the 14-day RSI remains above its 30 line, while the MACD, although below zero, stands above its signal line. These momentum signs give me additional reasons to remain neutral, at least for now.
• Support: 80.00 (S1), 79.40 (S2), 79.00 (S3).
• Resistance: 83.50 (R1), 85.00 (R2), 86.30 (R3).
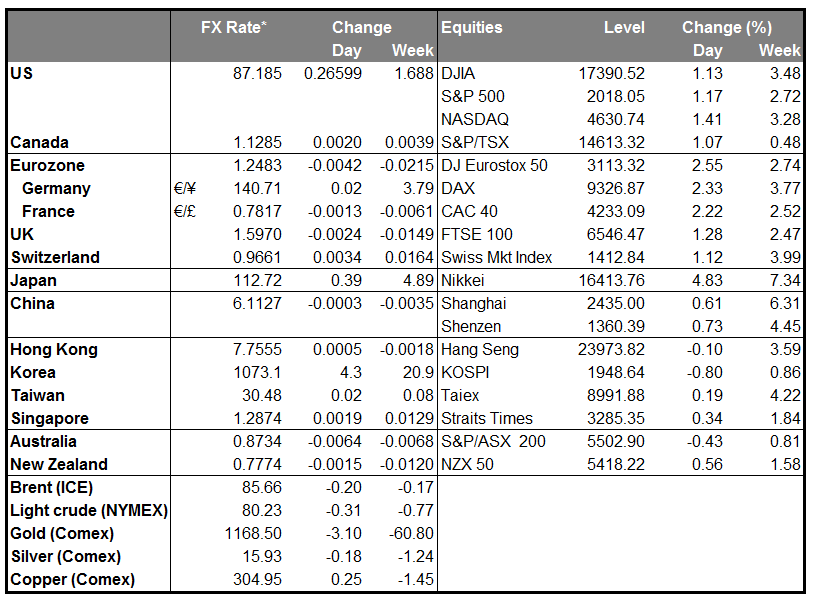
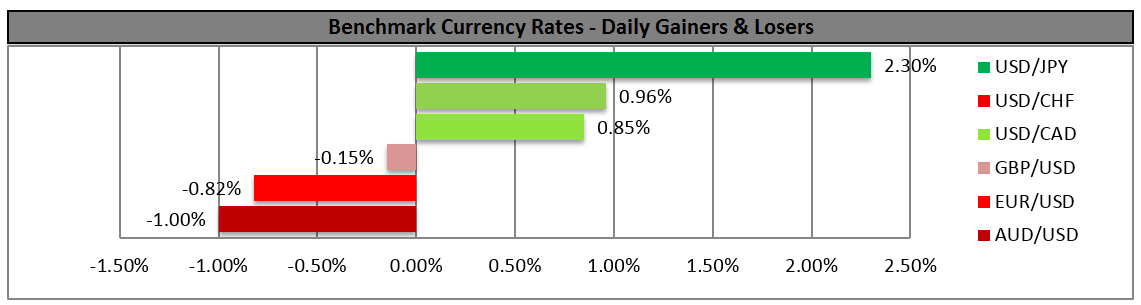
BENCHMARK CURRENCY RATES - DAILY GAINERS AND LOSERS
MARKETS SUMMARY