EUR/USD resilient around the 1.2660/80 resistance area
EUR/USD appears to be having a bit of breather after finding resistance around the area of 1.2660/80 (R1), where it advanced during the ECB President Draghi speech. Shifting our attention to our momentum studies, the RSI found resistance near its 50 line and is pointing down, while MACD still in its negative territory remains above its trigger line. These mixed momentum signs could settle on a direction after the nonfarm payrolls release later in the day. In the bigger picture, the pair is printing lower highs and lower lows and I will stick to my view that the overall path remains to the downside.
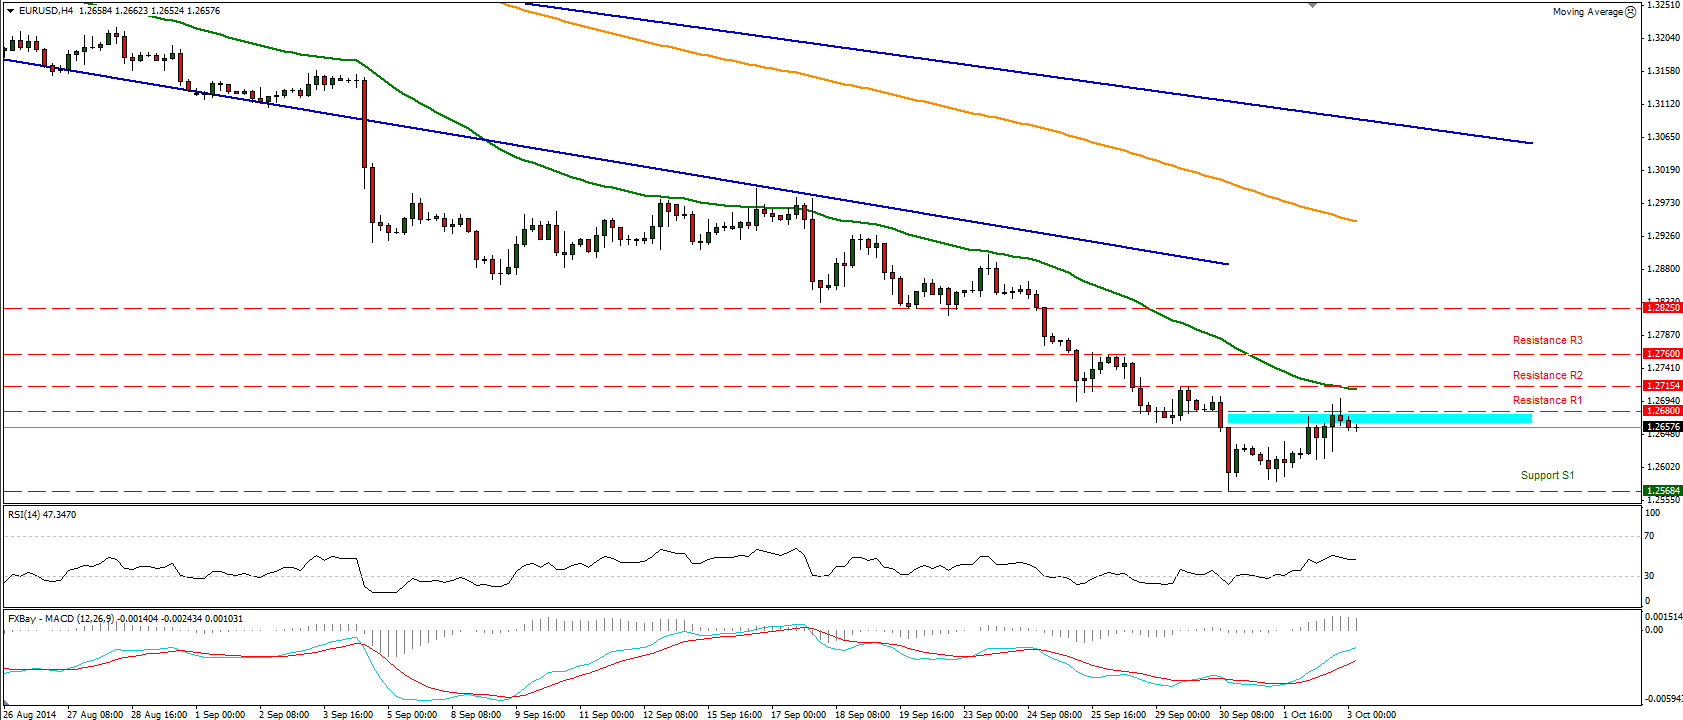
• Support: 1.2568 (S1), 1.2500 (S2), 1.2460 (S3).
• Resistance: 1.2660/80 (R1), 1.2693 (R2), 1.2760 (R3).
GBP/USD moved lower
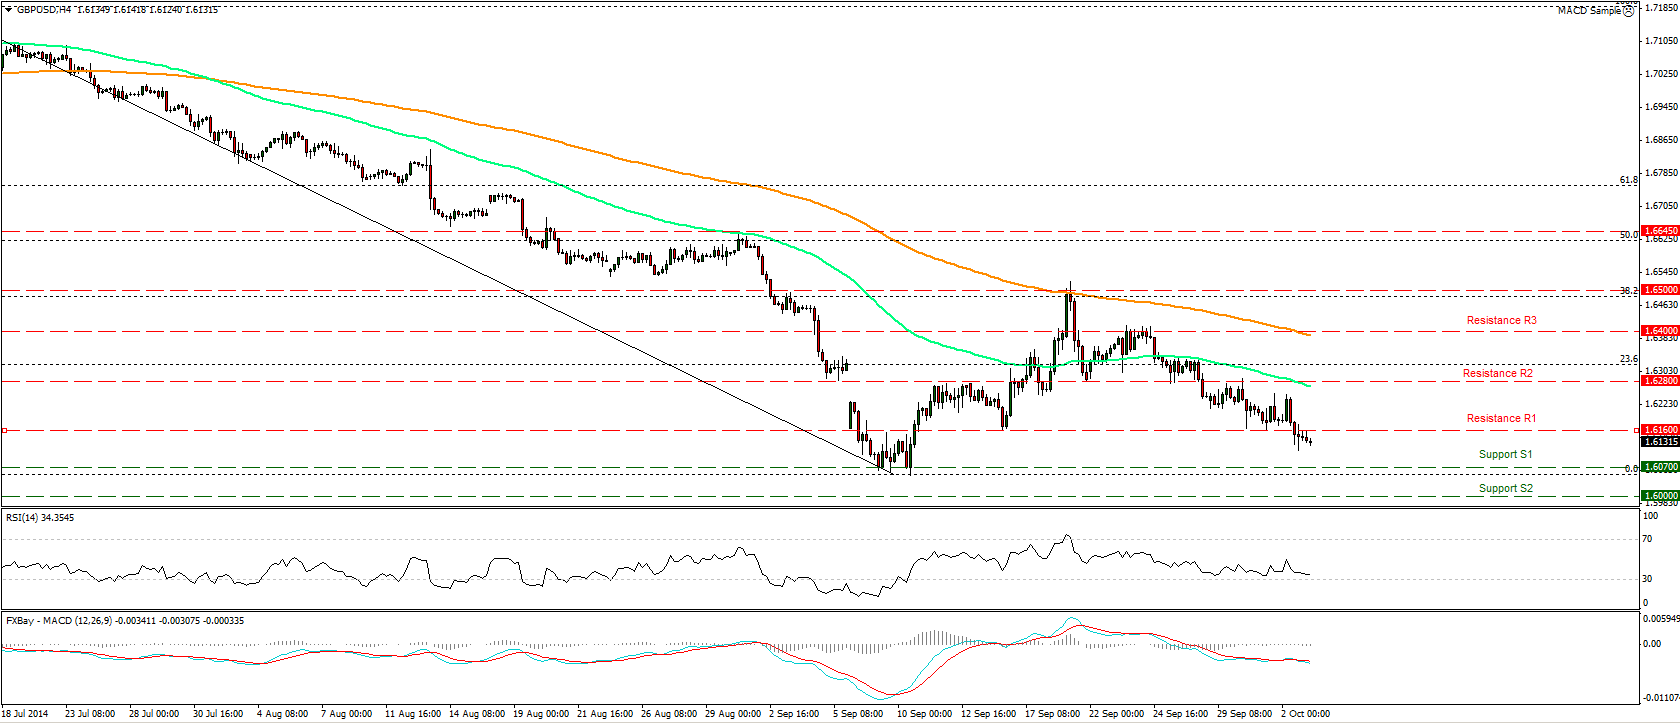
GBP/USD moved lower on Thursday, breaking below the support-turned-into resistance line of 1.6160. I would expect further extension lower since this level is breached and the pair may stage another test near the 1.6070 (S1) support level. On the daily chart, the 14-day RSI touched its 30-line and is pointing down, while the daily MACD show signs of topping and is ready to cross below its trigger line. Our momentum studies support the view that the decline could continue if the bears prove strong enough.
• Support: 1.6070 (S1), 1.6000 (S2), 1.5970 (S3) .
• Resistance: 1.6160 (R1), 1.6280 (R2), 1.6400 (R3).
USD/JPY heads towards 109.25
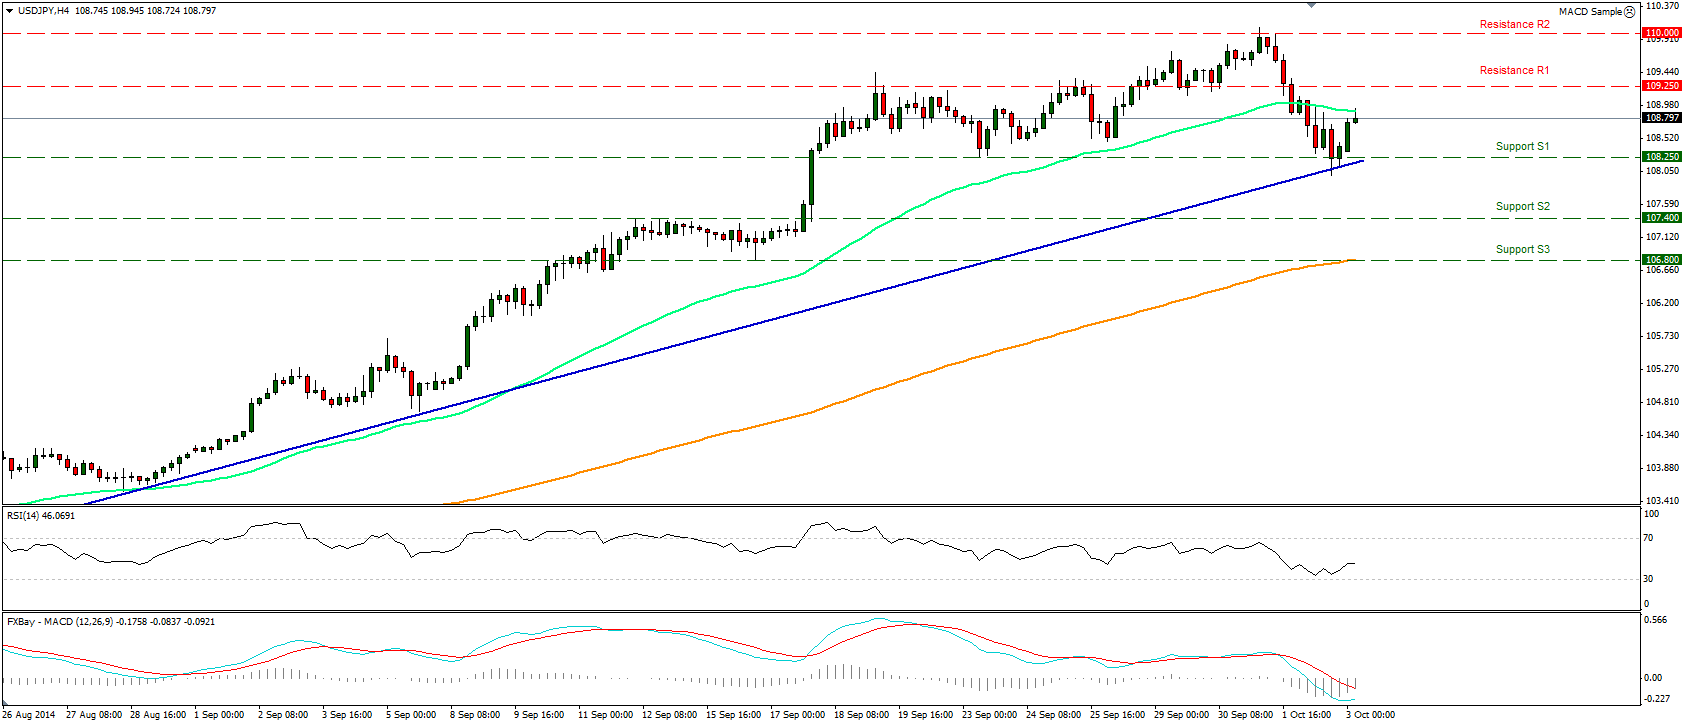
USD/JPY declined yesterday before bouncing off major support level of 108.25 (S1). During early European morning the pair is heading towards the 109.25 (R1) resistance level. A break above that could trigger further buying of the pair. On the daily chart, I still see a long-term uptrend, since the price structure remains higher highs and higher lows above both the 50- and the 200-day moving averages.
• Support: 108.25 (S1), 107.40 (S2), 106.80 (S3).
• Resistance: 109.25 (R1), 110.00 (R2), 110.70 (R3).
Gold moved in a consolidative mode
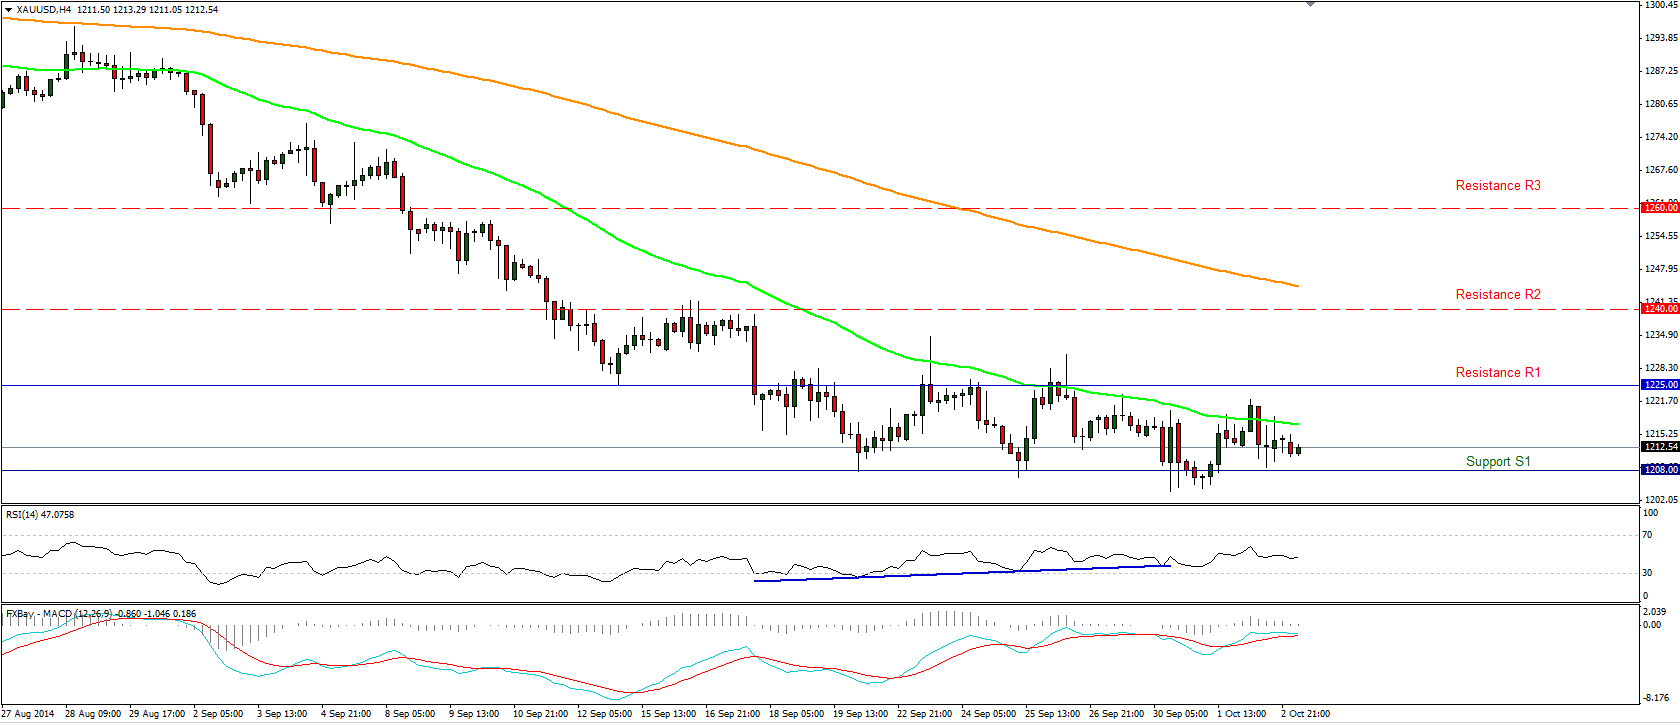
Gold remains trapped in a range between the 1208 (S1) support area and the resistance of 1225 (R1). Since the precious metal seems to be oscillating between these two lines, a break in either direction is likely to determine the forthcoming near-term bias. On the daily chart, the price structure still suggests a downtrend, but our daily momentum indicators give me an extra reason to remain flat. The 14-day RSI exited its oversold field and is now pointing sideways, while the daily MACD still in its negative territory poked its nose above its signal line.
• Support: 1208 (S1), 1200 (S2), 1180 (S3).
• Resistance: 1225 (R1), 1240 (R2), 1260 (R3).
WTI plunged and surged again
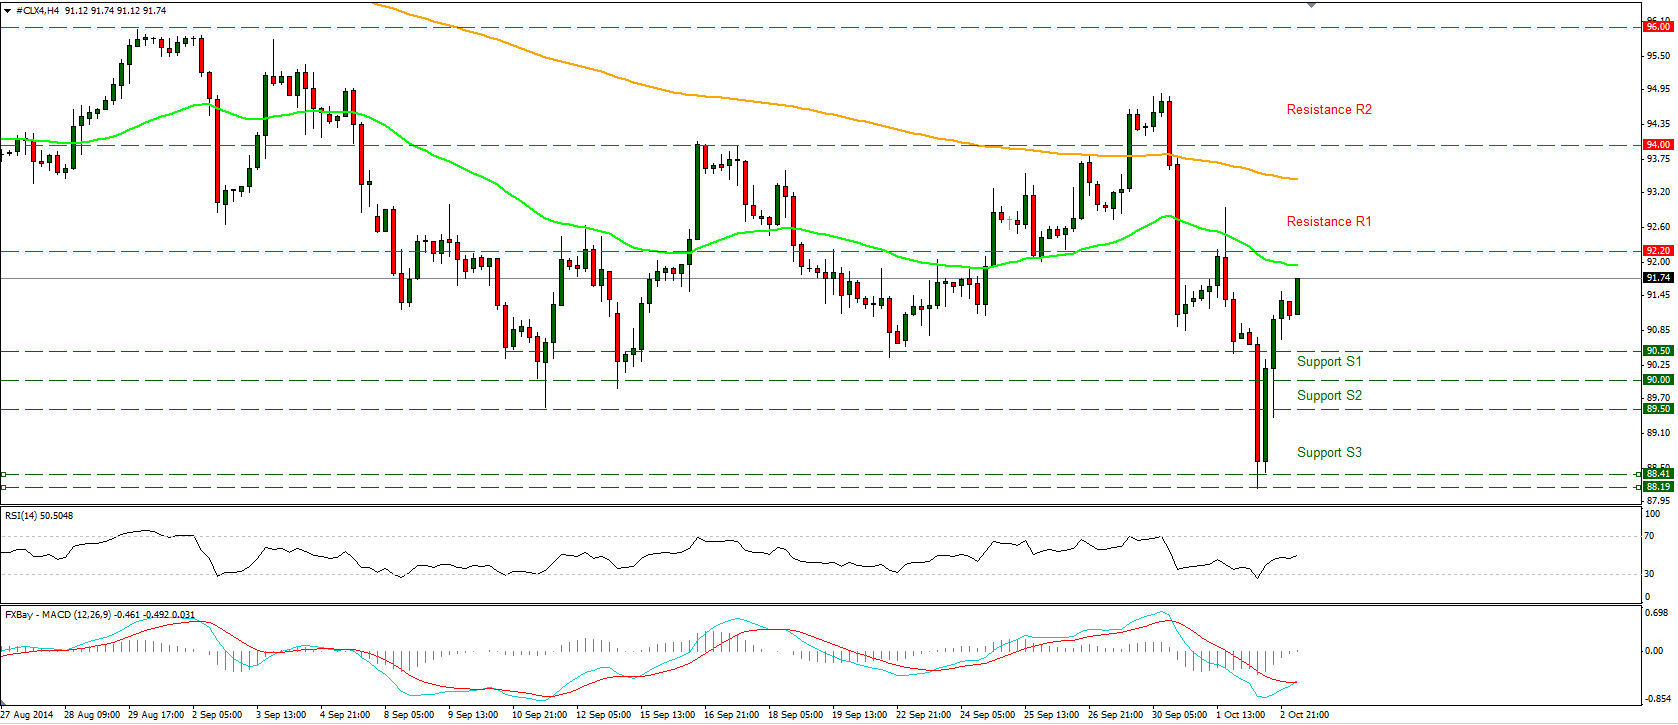
WTI plunged yesterday, violating three support lines in a row but surged back again and remained elevated overnight, suggesting that a test of the 92.20 (R1) resistance line is near. The move was halted at the 88.20/40 area, the lows of April 2013. Having in mind the sharp rise and declines, I would prefer to remain neutral as the price structure does not suggest trending conditions. The MACD lies below its zero line and seems ready to cross its trigger line the RSI found support at its 30 line and bounce again from its oversold level.
• Support: 90.50 (S1), 90.00 (S2), 89.50 (S3).
• Resistance: 92.20 (R1), 94.00 (R2) , 96.00 (R3).
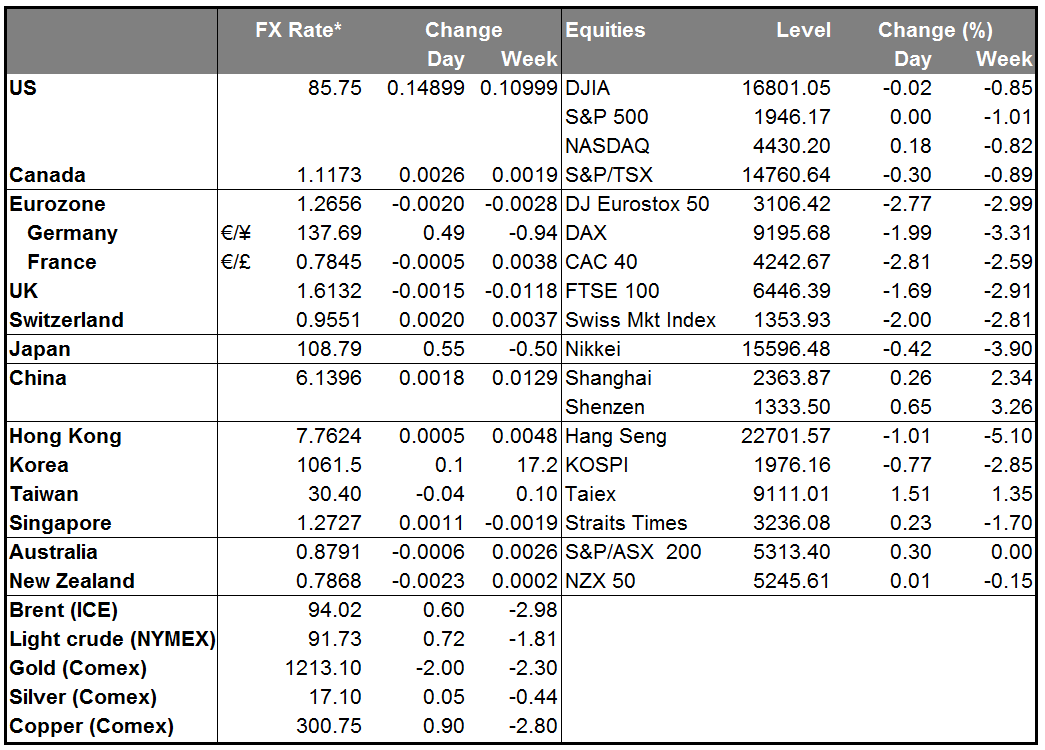
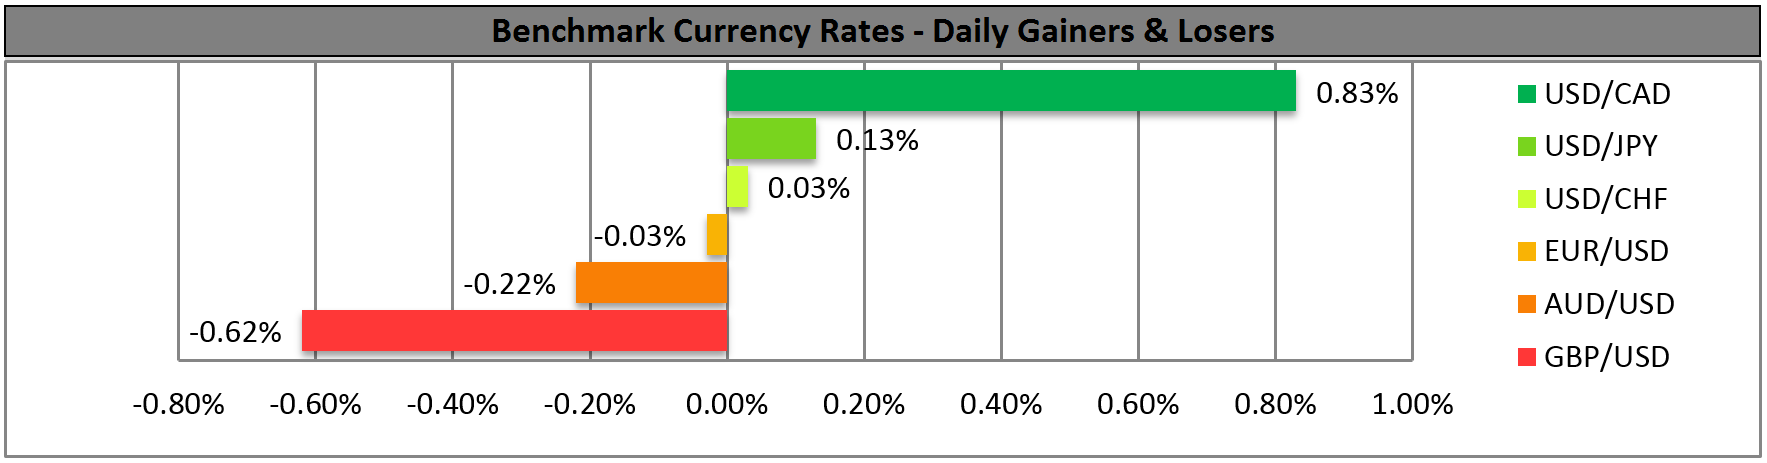
BENCHMARK CURRENCY RATES - DAILY GAINERS AND LOSERS
MARKETS SUMMARY