EUR/USD touches 1.3107
EUR/USD moved slightly lower on Tuesday to touch 1.3107, marginally above our support line of 1.3100 (S1), the lows of the 6th of September 2013. At the European opening, the rate is trading between that support line and the resistance of 1.3152 (R1). I would take to the sidelines now, for three reasons: 1) our proximity to the lower boundary of the blue downside channel, connecting the highs and the lows on the daily chart; 2) the positive divergence between our momentum studies and the price action, and 3) tomorrow we have the ECB policy meeting, which could bring a surprise either way. The possibility of a rebound near the lower line of the channel remains high. Although I remain flat for now, I still see a negative overall picture, since EUR/USD is trading within the aforementioned downside channel and also below both the 50- and the 200- day moving averages. If the bears get a reason to push the rate lower, we are likely to see extensions towards the psychological zone of 1.3000 (S2).
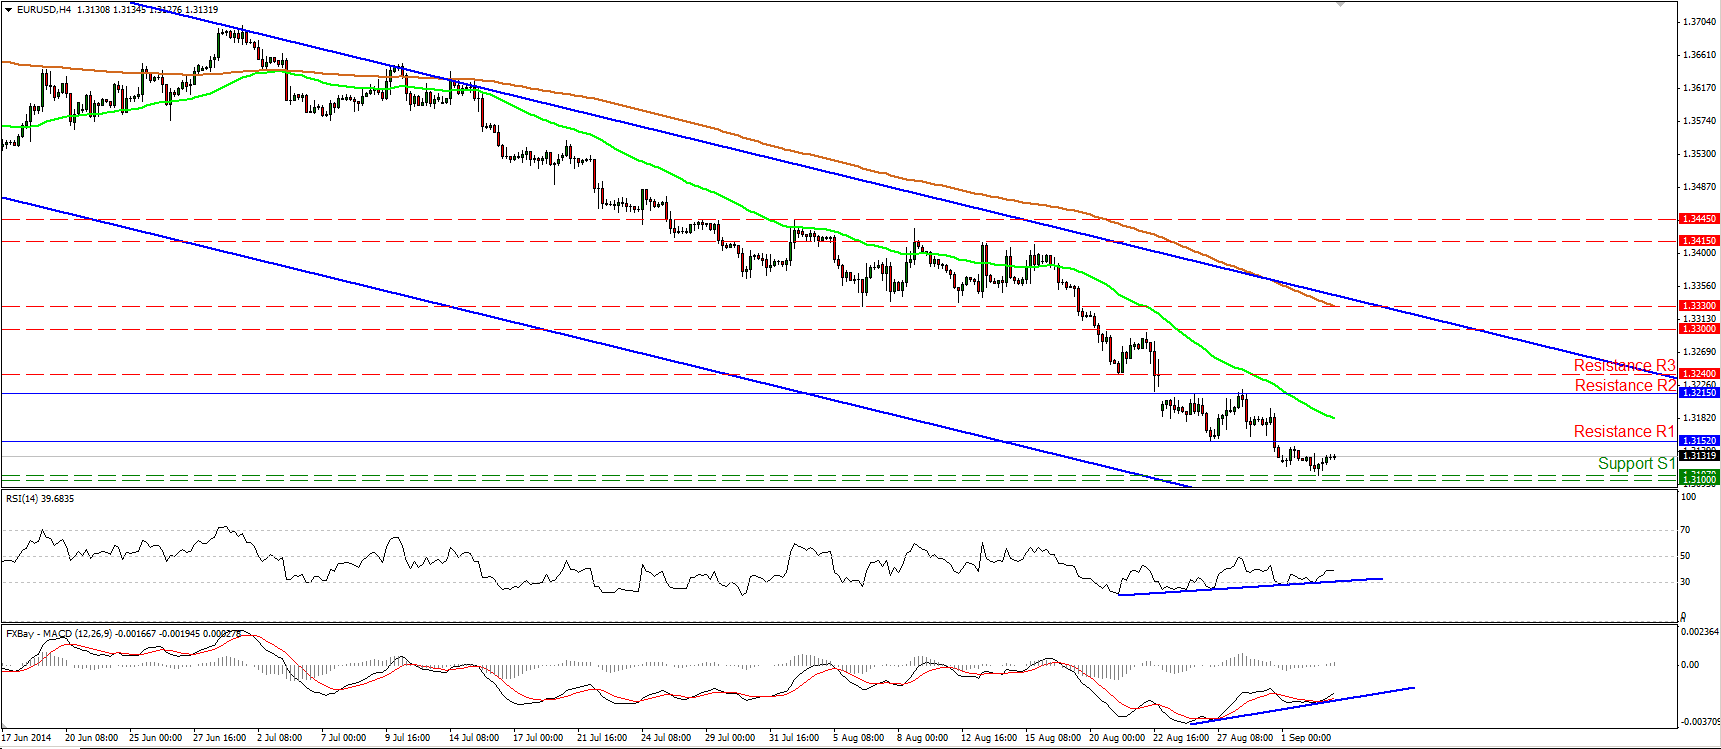
• Support: 1.3100 (S1), 1.3000 (S2), 1.2900 (S3).
• Resistance: 1.3152 (R1), 1.3215 (R2), 1.3240 (R3).
GBP/USD: The downtrend is back in force
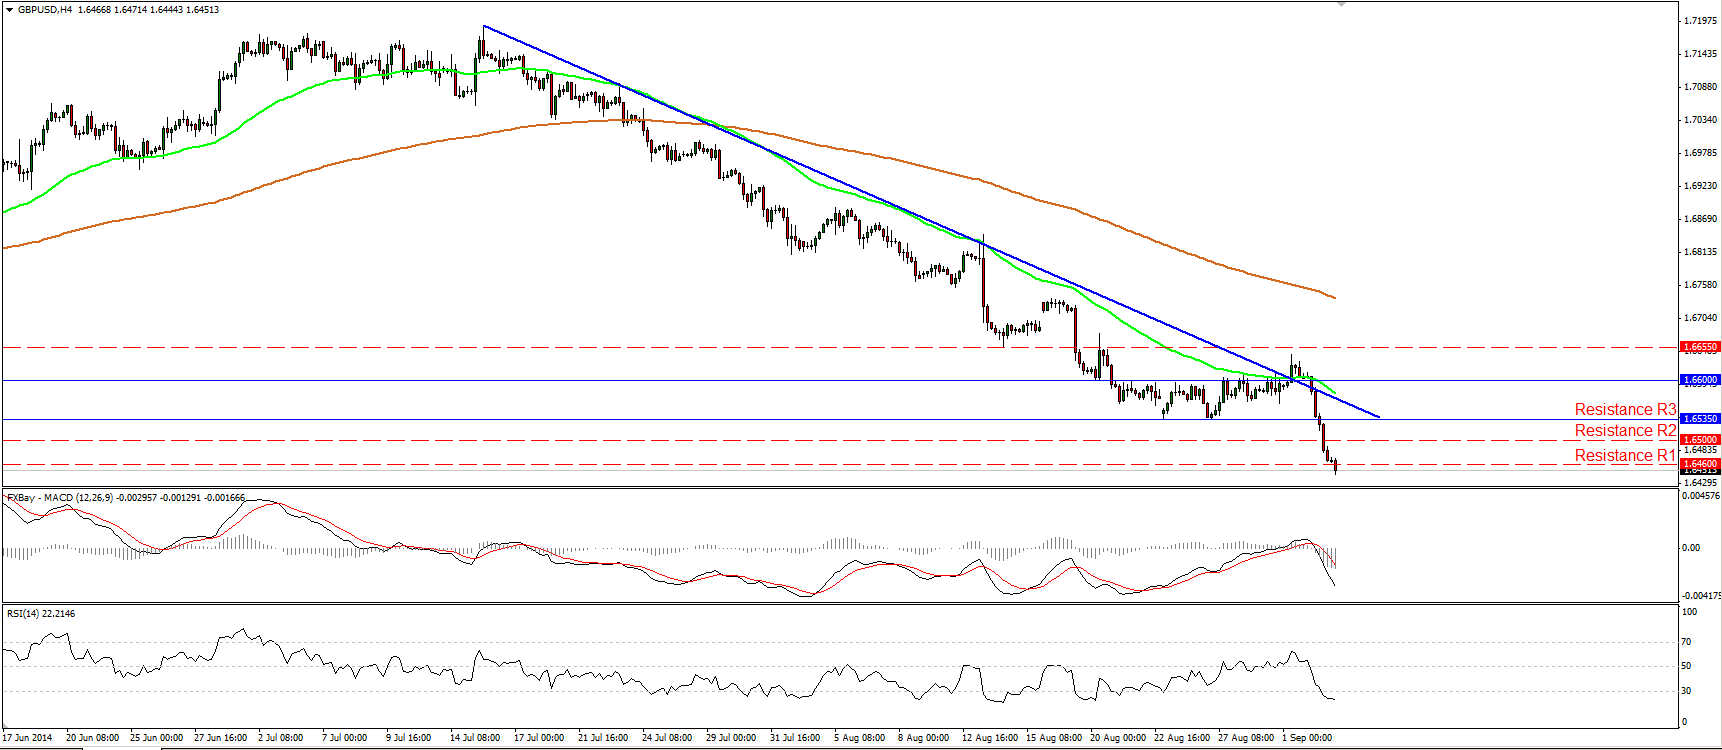
GBP/USD collapsed after a minor move above the 1.6600 line. The pair moved below the psychological barrier of 1.6500 and also below our support line (turned into resistance) of 1.6460. This signals the continuation of the downtrend and could carry larger bearish implications. I would expect the dip below 1.6460 to open the way for our next support zone, at 1.6350 (S1). On the daily chart, Cable remains below the 80-day exponential moving average, the moving average that supported the lows of the price action for a whole year. As a result, the overall outlook remains negative in my view, and I would see any possible bullish moves below that moving average as corrective waves.
• Support: 1.6350 (S1), 1.6260 (S2), 1.6200 (S3).
• Resistance: 1.6460 (R1), 1.6500 (R2), 1.6535 (R3).
EUR/JPY surges but still within a major downside channel

EUR/JPY surged on Tuesday, violating two resistance obstacles in a row. At the European opening, the rate is trading slightly above the 138.00 (S1) barrier and I would expect it to challenge our next line at 138.45 (R1). Zooming in on the 1-hour chart, the 14-hour RSI looks ready to exit overbought conditions, while the hourly MACD has topped and moved below its signal line. Having in mind these momentum signals and the fact that the rally was too steep, I would expect a pullback before the bulls prevail again. Although I would expect the upside leg to continue, on the daily chart, the rate is still trading within a downside channel, drawn from back the beginning of April. Thus I see the pair in a retracing mode for now. I will reconsider my analysis if buyers are strong enough to exit the channel.
• Support: 138.00 (S1), 137.40 (S2), 136.65 (S3).
• Resistance: 138.45 (R1), 138.75 (R2), 139.25 (R3).
Gold breaks a long-term support line
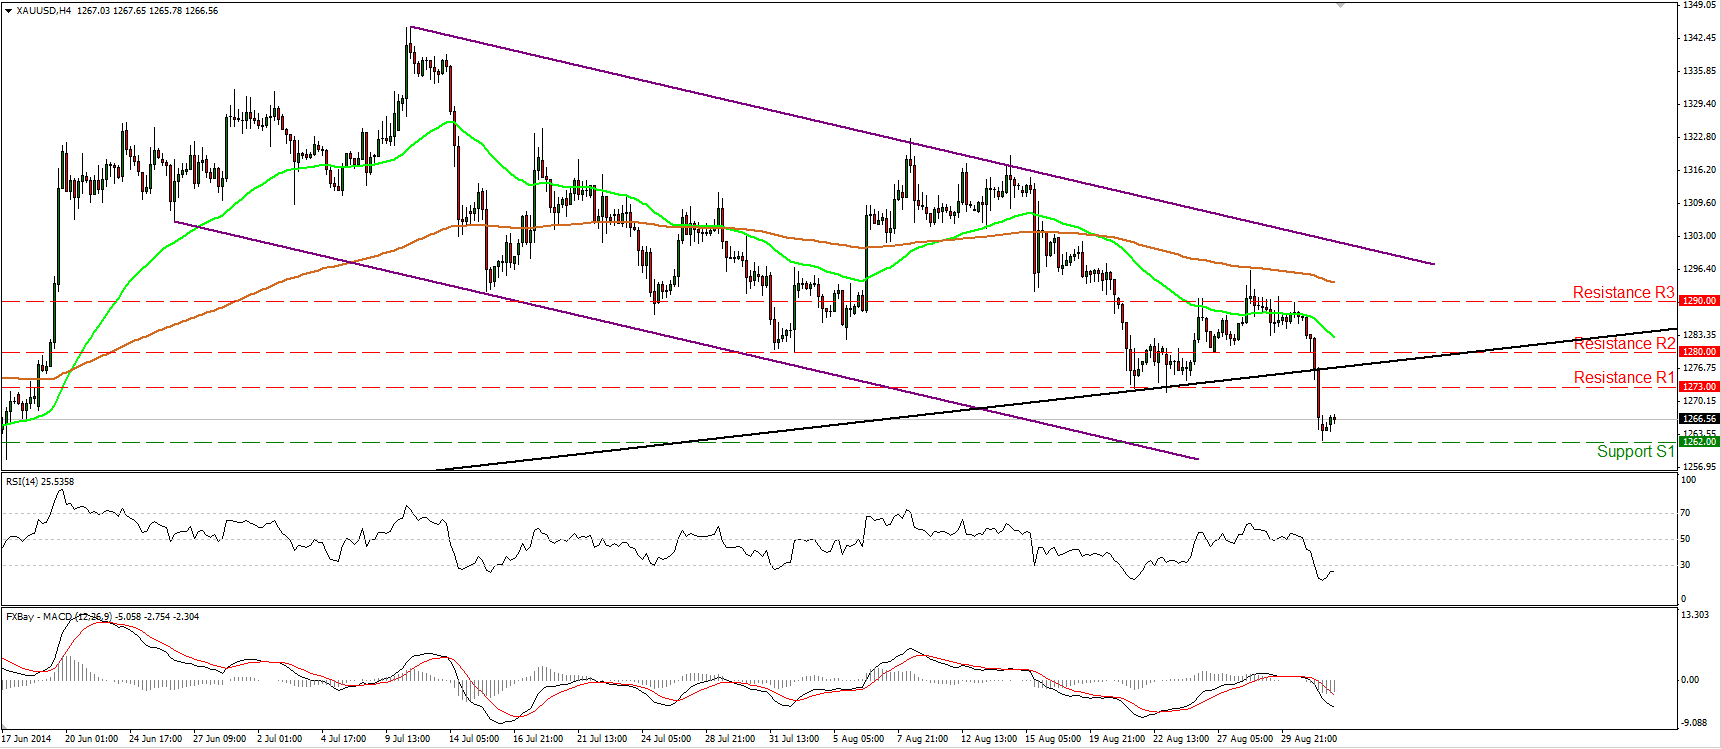
Gold collapsed, dipping below the long-term upside support line (black line) drawn from back at the low of the 30th of December and below 1273. The decline was halted at 1262 (S1), but the plunge shifts the bias back to the downside in my view. A clear dip below the 1260/62 zone could pull the trigger for further downside extensions, perhaps towards the 1250 line. As long as the metal is trading within the purple downside channel and below the black long-term support line, I would consider the overall picture to be negative. However, on the 1-hour chart, the 14-hour RSI exited its oversold zone, while the hourly MACD moved above its trigger line. As a result, I would be cautious that the minor corrective wave may continue before the bears pull the trigger again.
• Support: 1262 (S1), 1250 (S2), 1240 (S3).
• Resistance: 1273 (R1), 1280 (R2), 1290 (R3).
WTI plunges back below 95.00
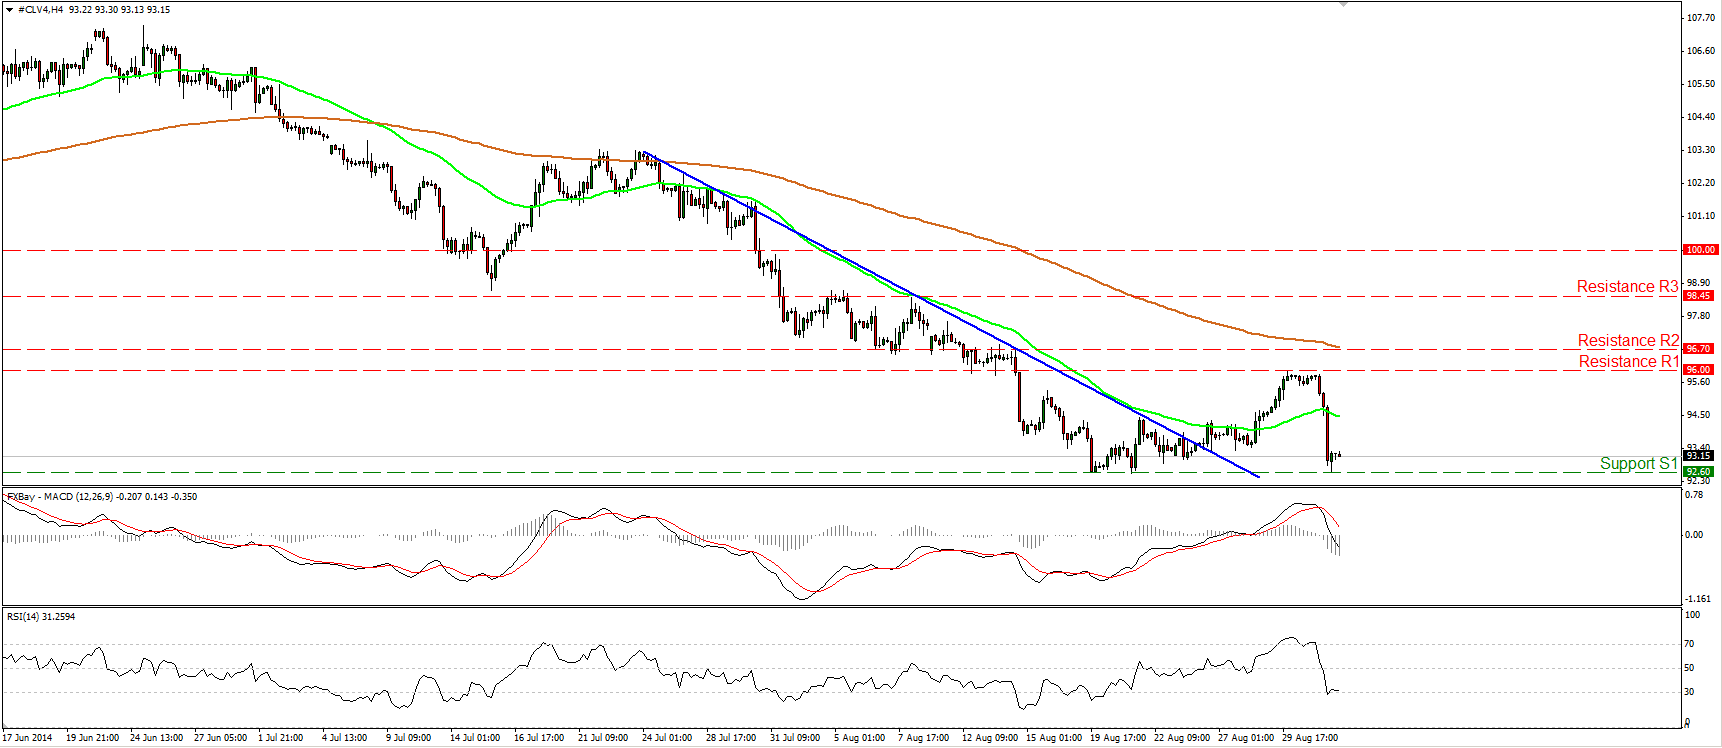
WTI tumbled back below 95.00 after finding resistance at the 96.00 (R1) barrier. The plunge was stopped by the 92.60 (S1) key support, defined by the lows of the 19th and the 21st of August. Having in mind that the 92.60 (S1) line provided reliable support in the recent past, I would adopt a neutral stance for now. Only a dip below that hurdle will shift my attention to the downside. Such a dip would be likely to target our next support, at 91.60 (S2). On the daily chart, despite the sharp fall, the MACD remains in a rising mode above its signal line, which gives me an additional reason to stay flat for now.
• Support: 92.60 (S1), 91.60 (S2), 90.00 (S3).
• Resistance: 96.00 (R1), 96.70 (R2), 98.45 (R3).
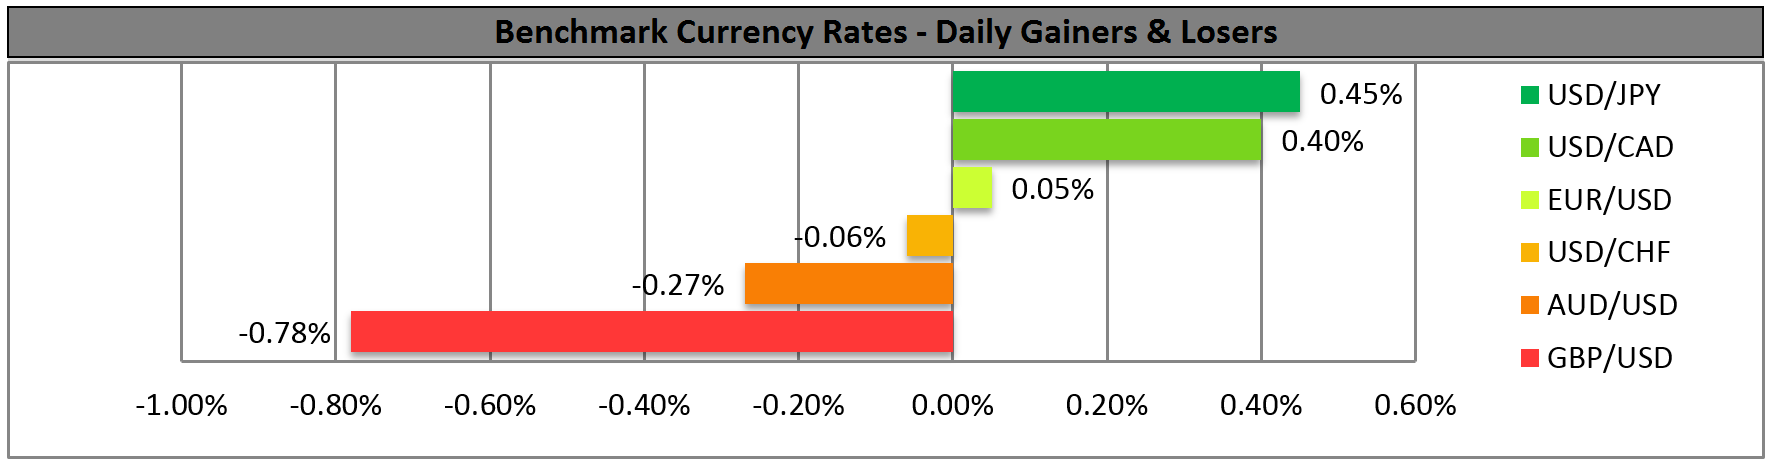
BENCHMARK CURRENCY RATES - DAILY GAINERS AND LOSERS
MARKETS SUMMARY