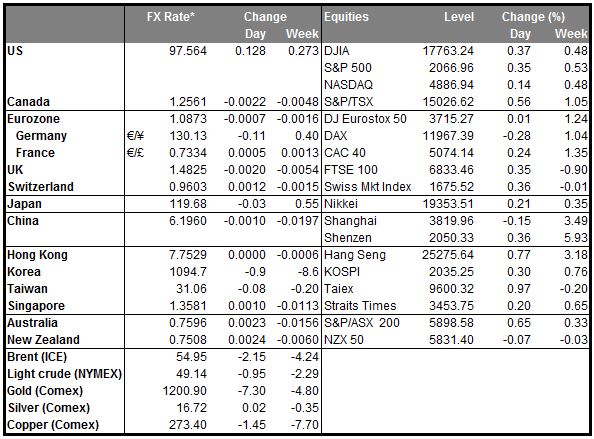
EUR/USD waits for the US employment data
EUR/USD raced higher on Thursday, breaking above the resistance (now turned into support) line of 1.0800 (S1), but the advance was halted below our next resistance. Despite yesterday’s advance, the possibility for a lower high still exists. Today we get the US employment report for March. A strong report could give sellers a reason to take advantage of yesterday’s climb and shoot the rate down, perhaps even back below the 1.0800 (S1) barrier. The RSI edged above its 50 line, while the MACD, already above its trigger, obtained a positive sign and confirmed Thursday’s positive momentum. In any case, I still believe that the overall trend is negative. EUR/USD is printing lower peaks and lower troughs below both the 50- and the 200-day moving averages. I would treat 13th – 26th of March recovery as a corrective move and I would expect the bears to eventually take control and drive the battle lower.
• Support: 1.0800 (S1), 1.0700 (S2), 1.0610 (S3).
• Resistance: 1.0950 (R1), 1.1045 (R2), 1.1165 (R3).
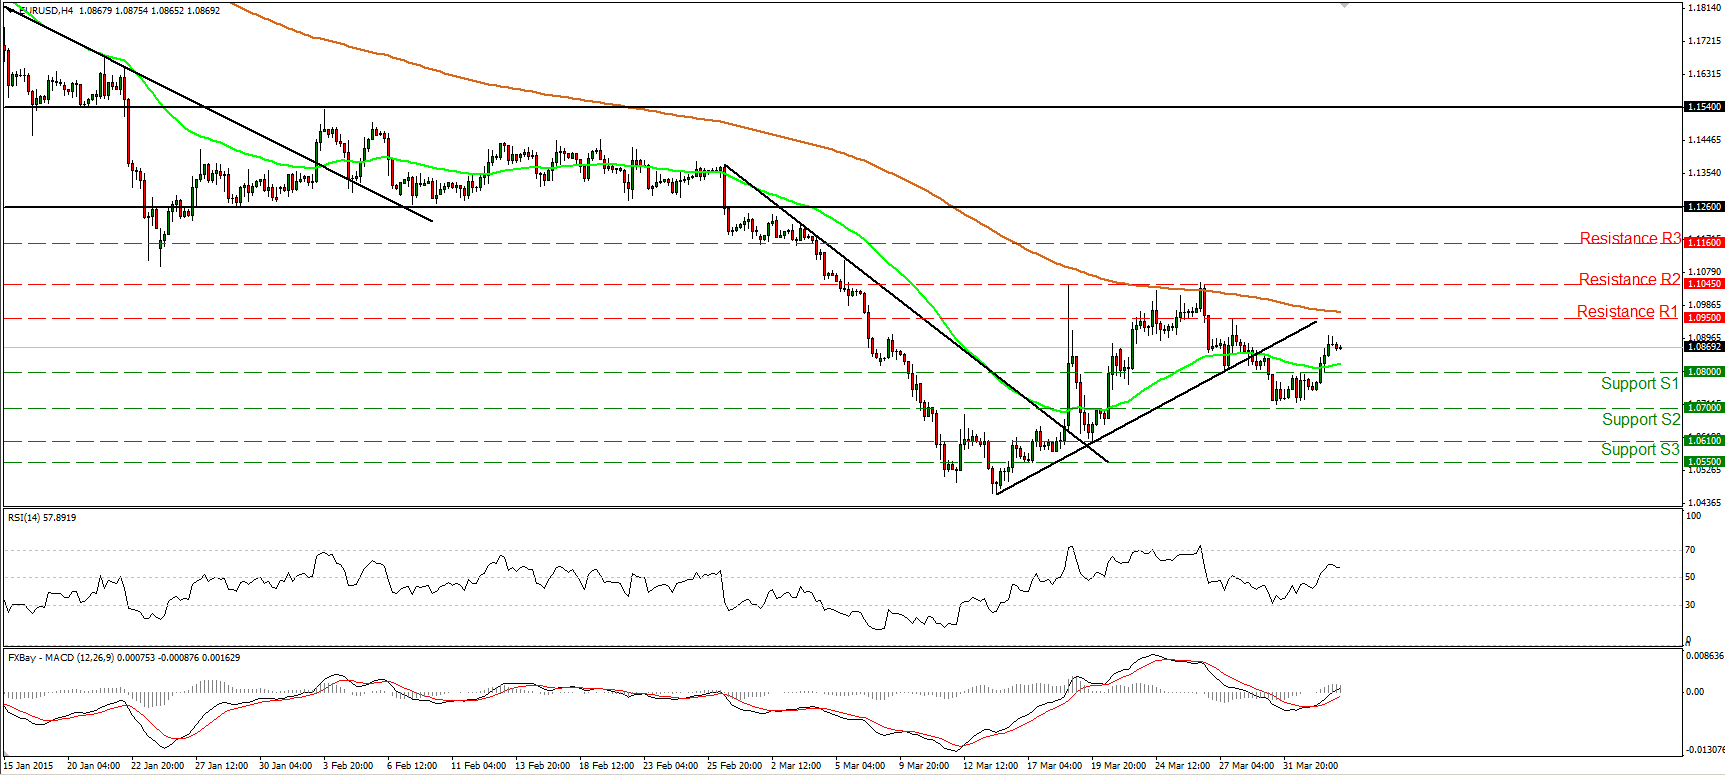
GBP/JPY stays neutral
GBP/JPY continued to trade in a sideways mode between the support line of 176.70 (S1) and the resistance of 178.35 (R2). The trendless mode is reflected on our short-term momentum studies as well. The RSI gyrates around its 50 barrier, while the MACD stands near its zero line and points sideways. However, having in mind that on the daily chart, the rate is still trading below the 200-period moving average, I would expect the forthcoming wave to be negative, perhaps for another test at 176.70 (S1). A break below that line could open the way for our next support at 176.00 (S2). As for the bigger picture, the rate is still trading below the 200-day moving average, while a decisive dip below 176.00 (S2) could complete a 5-month failure swing top and perhaps turn the overall outlook negative.
• Support: 176.70 (S1), 176.00 (S2), 175.50 (S3).
• Resistance: 177.90 (R1), 178.35 (R2), 179.25 (R3).
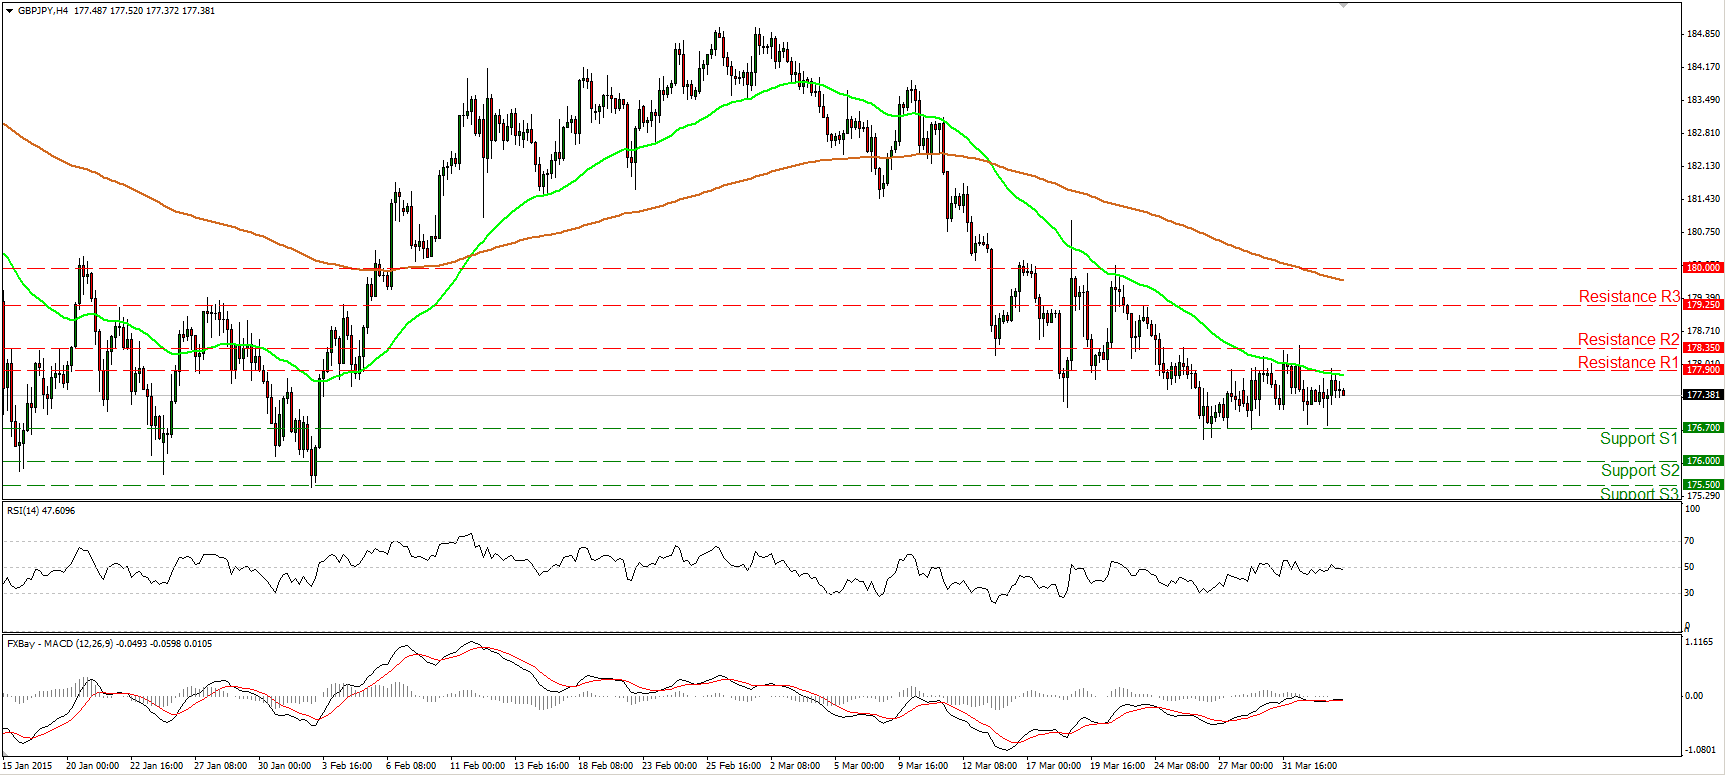
USD/CAD slides back near 1.2535
USD/CAD hit resistance marginally below the 1.2800 critical line and subsequently it started falling. At the European opening today it is trading near the 200-period moving average, slightly above our support line of 1.2535 (S1). In the absence of any clear trending structure on the 4-hour chart, I would switch my stance to neutral now. On the daily chart, the rate is still trading above the 50- and 200-day moving average. The upside exit of the triangle and then the rebound from the 50-periond moving average support trend continuation and keep the overall path positive. However, there is strong negative divergence between our daily oscillators and the price action. This could cause a downside corrective move. On the upside, only a clear close above the strong hurdle of 1.2800 (R3) would signal a forthcoming higher high.
• Support: 1.2535 (S1), 1.2420 (S2), 1.2370 (S3).
• Resistance: 1.2655 (R1), 1.2750 (R2), 1.2800 (R3).
Gold consolidates above 1200
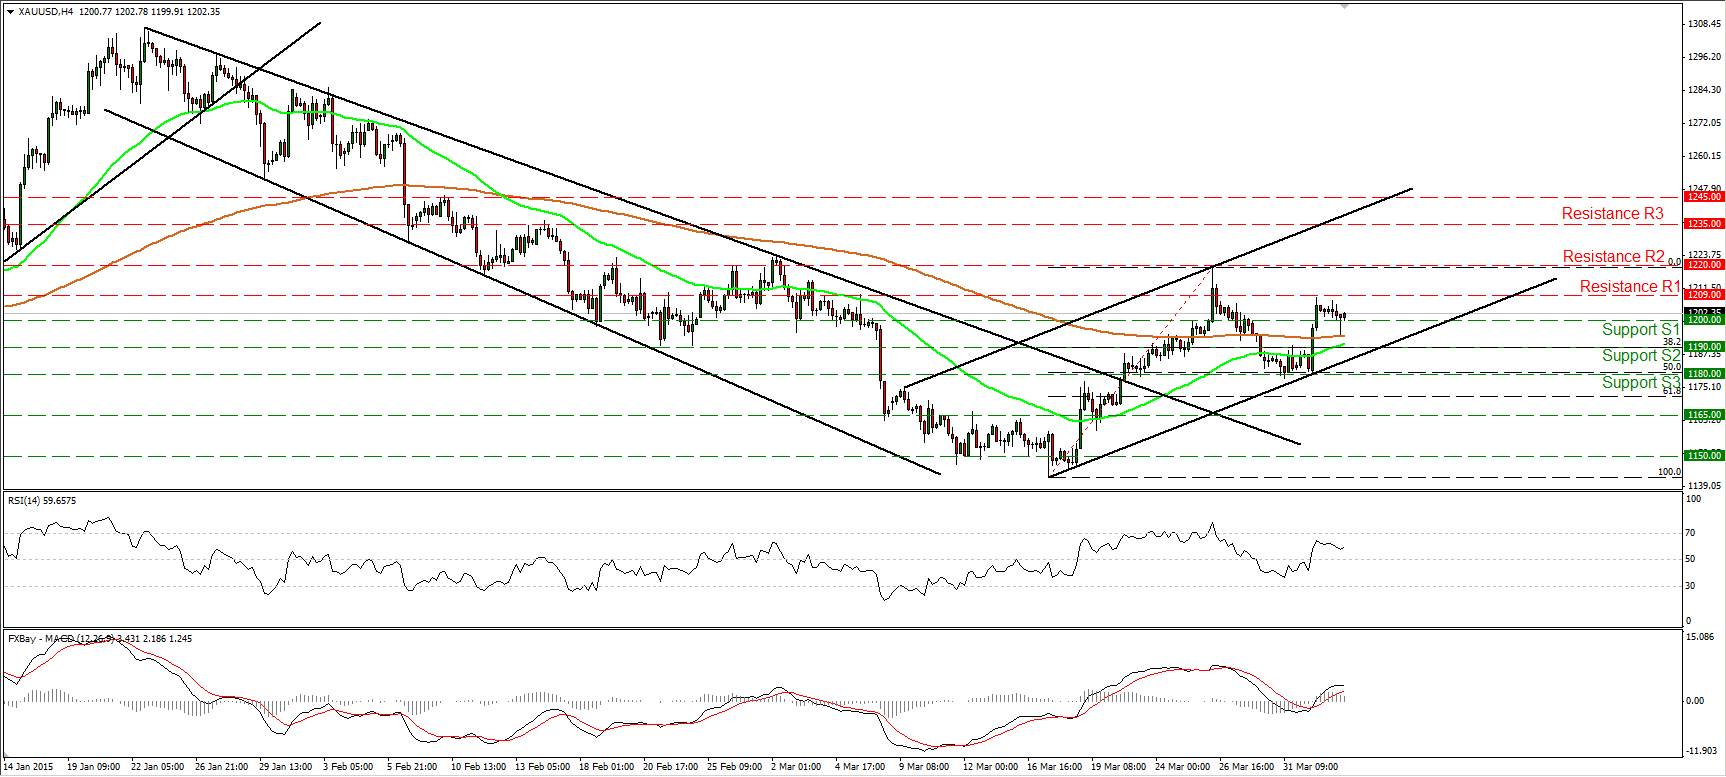
Gold moved in a consolidative manner on Thursday, staying above the psychological round figure of 1200 (S1), thus the picture is little changed. The likelihood for a lower high still exists, but there is a possibility for the completion of an inverted head and shoulders formation if the 1220 area is violated. For those reasons I would prefer to keep my neutral stance and wait for clearer directional signals. On the daily chart, the rebound at 1180 (S3), which stands near the 50% retracement level of the 17th – 26th of March up leg, printed a higher low, while our daily oscillators support further advances. The 14-day RSI stands above its 50 line, while the daily MACD, already above its trigger, appears ready to obtain a positive sign. These signs give me extra reasons to take the sidelines for now.
• Support: 1200 (S1), 1190 (S2), 1180 (S3).
• Resistance: 1209 (R1), 1220 (R2), 1235 (R3).
WTI pulls back
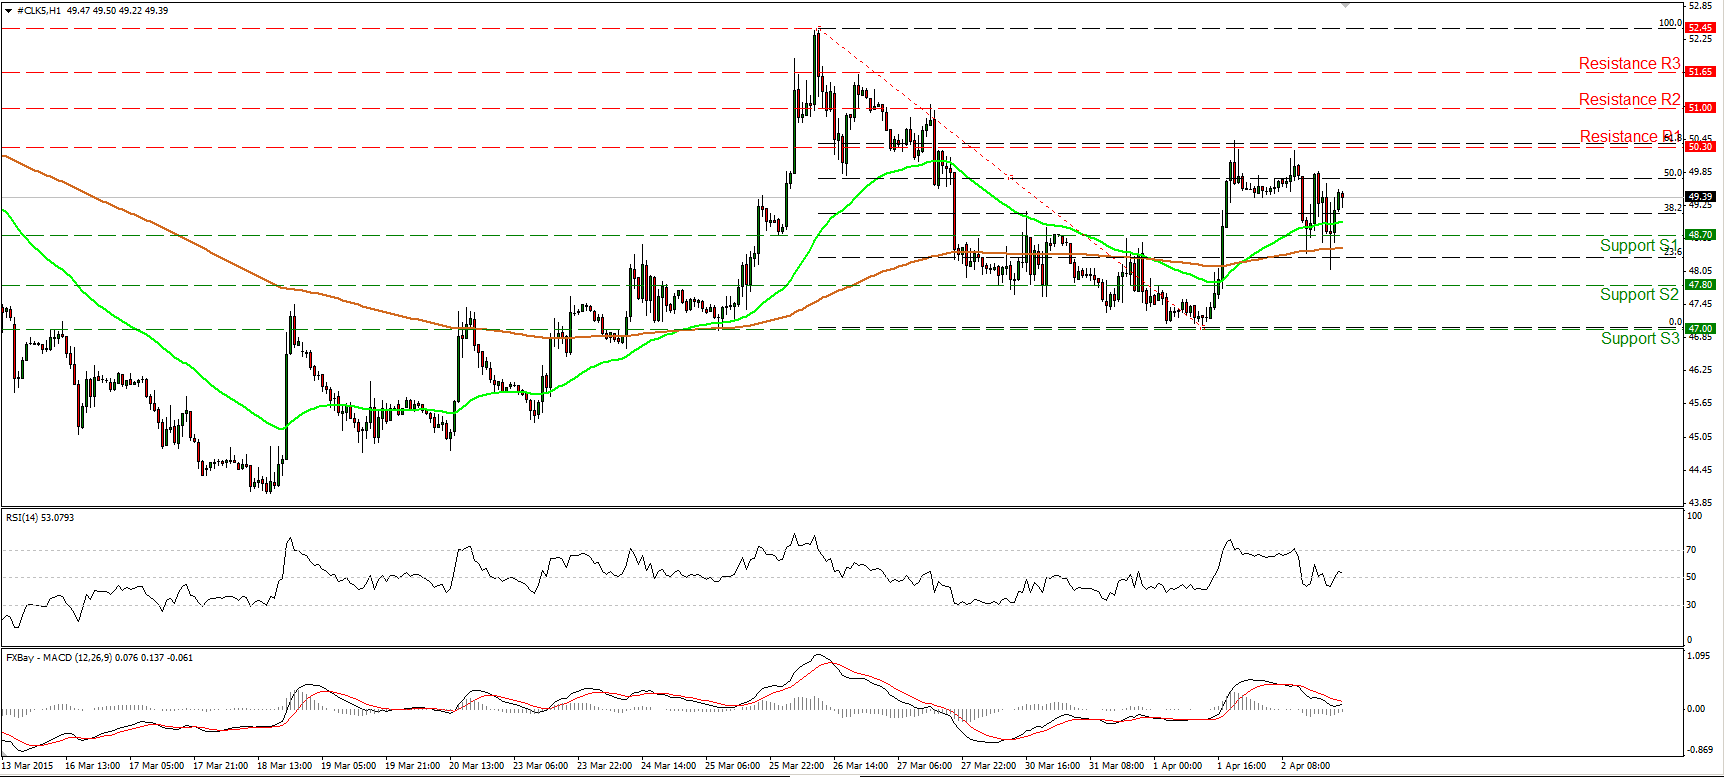
WTI traded lower yesterday, tried to close below the support of 48.70 (S1), but failed to do so, and subsequently rebounded somewhat. Yesterday’s move printed a higher low, thus I still see a cautiously positive short-term picture. However, I believe that only a break above the 61.8% retracement level of the 26th of March - 1st of April decline, at 50.30 (R1) would signal further advances, perhaps towards our next resistance at 51.00 (R2). Our hourly studies support the notion. The RSI is back above its 50 line, while the MACD, already positive, shows signs of bottoming and could move above its signal line any time soon. On the daily chart, WTI is trading below both the 50- and the 200-day moving averages. Nevertheless, there is still positive divergence between the daily oscillators and the price action. Therefore, I would prefer to wait for price and momentum to align before getting confident again with regards to the larger down path.
• Support: 48.70 (S1), 47.80 (S2), 47.00 (S3).
• Resistance: 50.30 (R1) 51.00 (R2), 51.65 (R3).
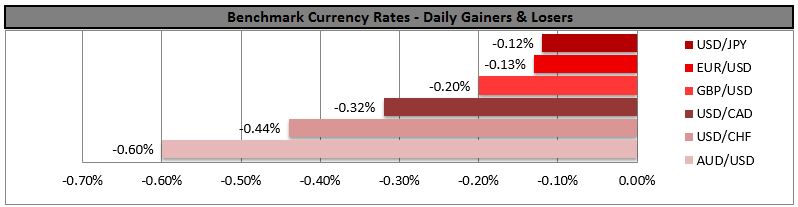
BENCHMARK CURRENCY RATES - DAILY GAINERS AND LOSERS
MARKETS SUMMARY