EUR/USD test of the 1.2660/80 resistance area is on the horizon
EUR/USD advanced after finding support at 1.2568 (S1) level and remained elevated overnight, suggesting that a test of the 1.2660/80 (R1) resistance zone is on the horizon. Ahead of the ECB meeting today, the pair itself is not giving any clear directional impulse. Looking at our momentum studies, the RSI moved above its 30 line and is pointing up, while MACD crossed above its trigger line. These momentum signs increase the likelihood for further advances, so we have to wait and see whether the bulls are strong enough to start a new attempt to cross the 1.2660/80 (R1) area. Much will depend on what Mr. Draghi and his colleagues decide. In the bigger picture, the pair is printing lower highs and lower lows and I maintain my view that the overall path remains to the downside.
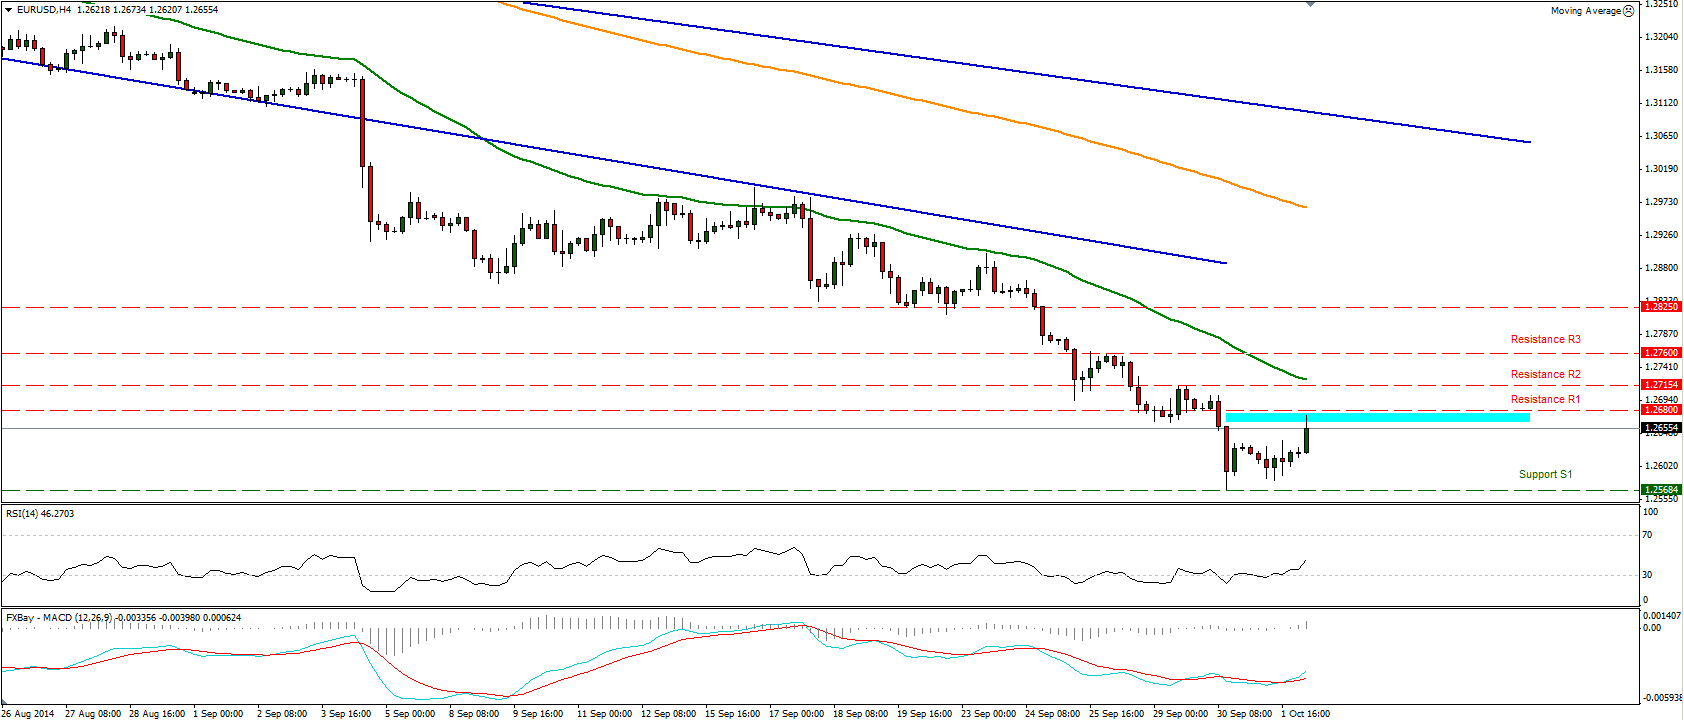
• Support: 1.2568 (S1), 1.2500 (S2), 1.2460 (S3).
• Resistance: 1.2660/80 (R1), 1.2693 (R2), 1.2760 (R3).
GBP/USD remains trapped in a range
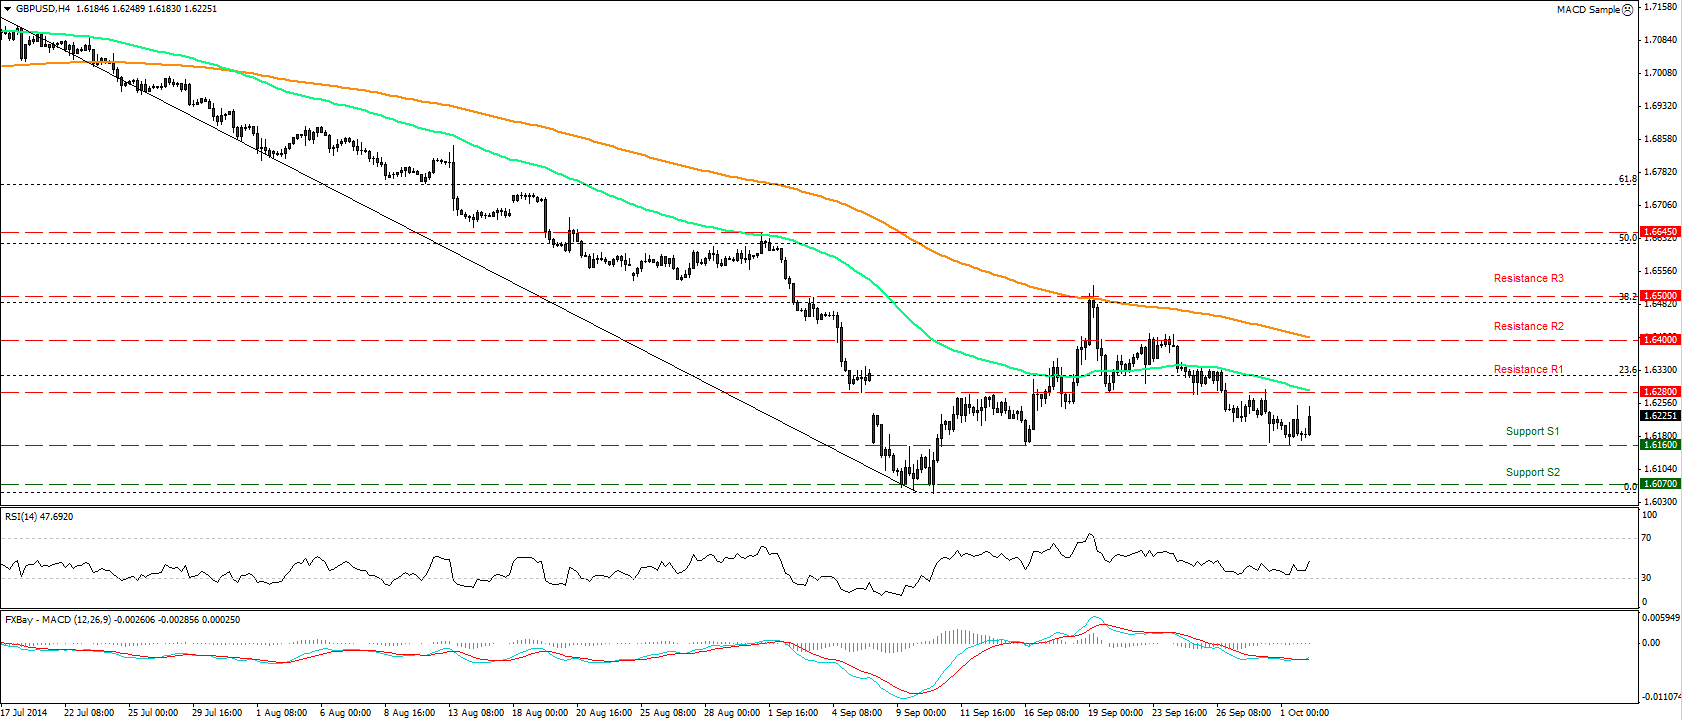
GBP/USD remains trapped in a range between the support line of 1.6160 (S1) and 1.6280 (R1) resistance level. As long as I don’t see a clear trending structure on the 4-hour chart, I would prefer to remain neutral. A clear breach of 1.6160 (S1) support level is needed before getting more confident about larger declines. Our momentum studies show that the RSI is above its 30 line and is pointing up, while the MACD already in its negative territory moves sideways with its trigger line. This also amplifies the case to remain neutral.
• Support: 1.6160 (S1), 1.6070 (S2), 1.6000 (S3).
• Resistance: 1.6280 (R1), 1.6400 (R2), 1.6500 (R3).
USD/JPY break below 109.25
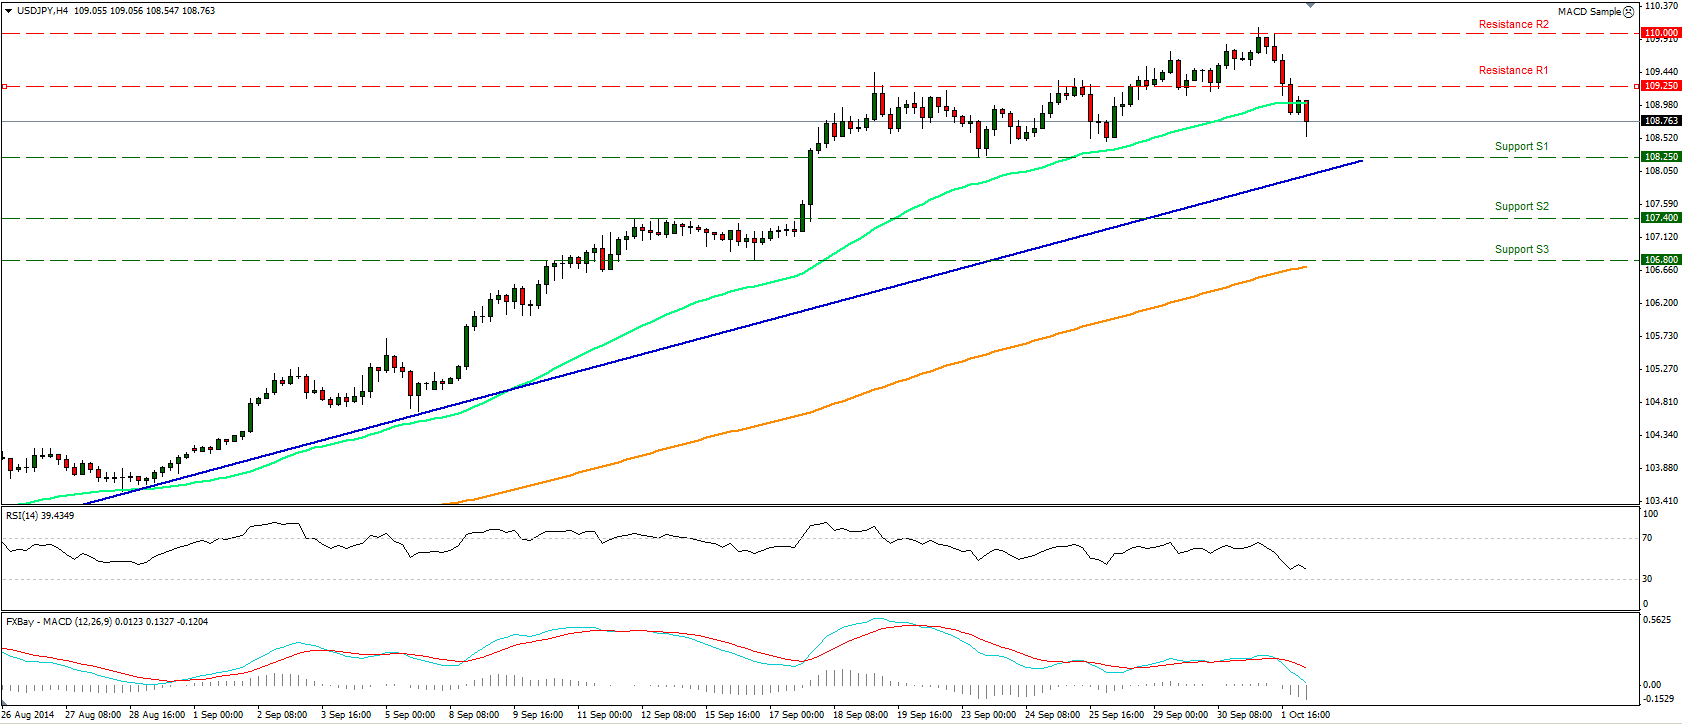
The rise in USD/JPY was stopped by the psychological line of 110.00 (R2) yesterday, after which the rate dropped and broke through the support-turned-into-resistance line of 109.25. During early European morning the pair is heading towards the 108.25 (S1) support level. A dip below that could have larger bearish implications. Despite the fall, I still see a long-term uptrend on the daily chart, since the price structure remains higher highs and higher lows above both the 50- and the 200-day moving averages.
• Support: 108.25 (S1), 107.40 (S2), 106.80 (S3).
• Resistance: 109.25 (R1), 110.00 (R2), 110.70 (R3).
Gold still trading sideways
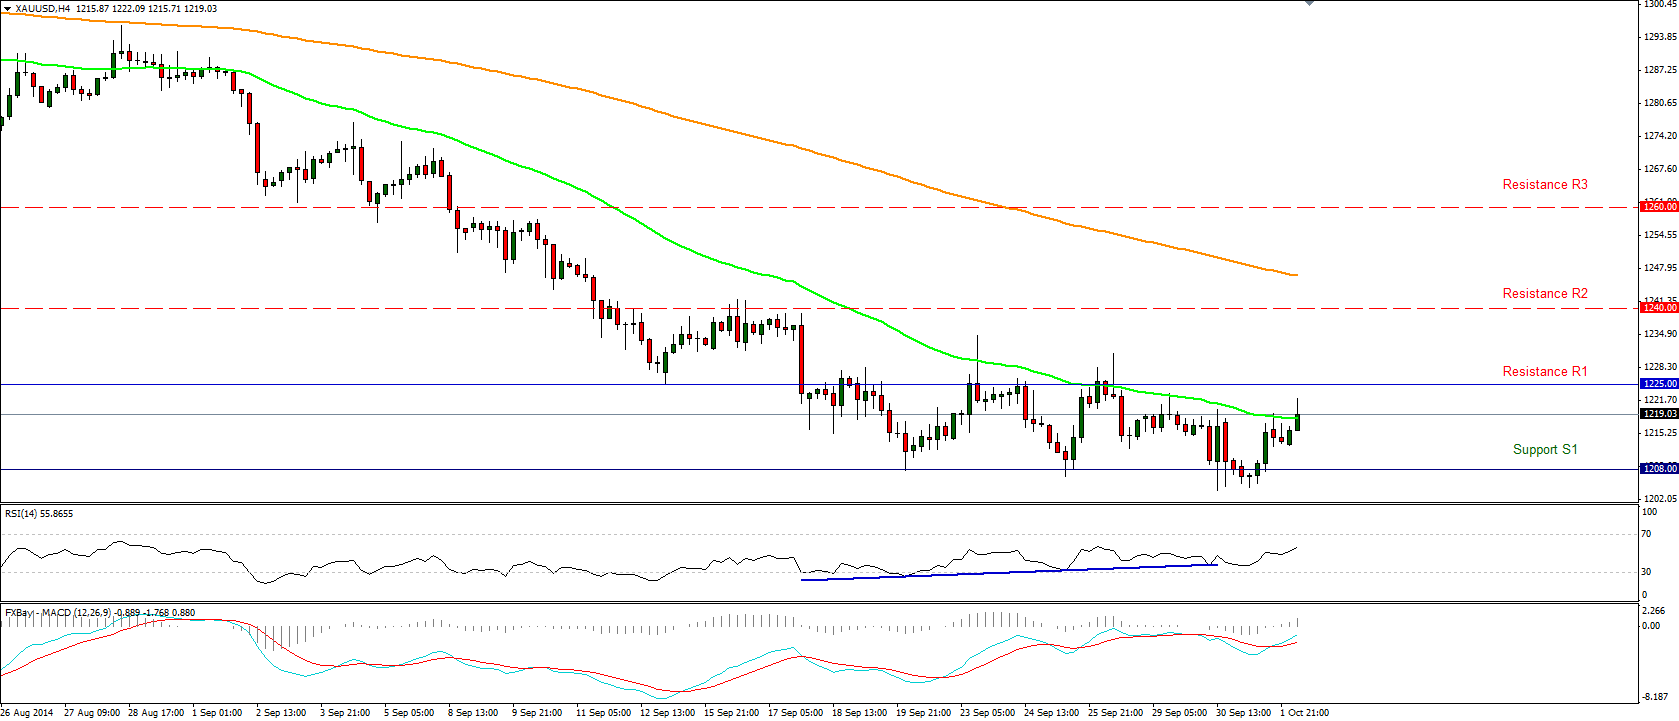
Gold moved higher on Wednesday and returned to the blue line channel, where it has been consolidating since 17th of September. The precious metal continues to trade sideways between the 1208 (S1) support area and the resistance of 1225 (R1). Since we are approaching a strong resistance area, I would prefer to remain flat and wait for a break above that level for further bullish extensions. On the daily chart, the price structure still suggests a downtrend, but our daily momentum indicators give me an extra reason to remain flat. The 14-day RSI exited its oversold field and is now pointing up, while the daily MACD shows signs of bottoming and moved above its signal line.
• Support: 1208 (S1), 1200 (S2), 1180 (S3).
• Resistance: 1225 (R1), 1240 (R2), 1260 (R3).
WTI undecided
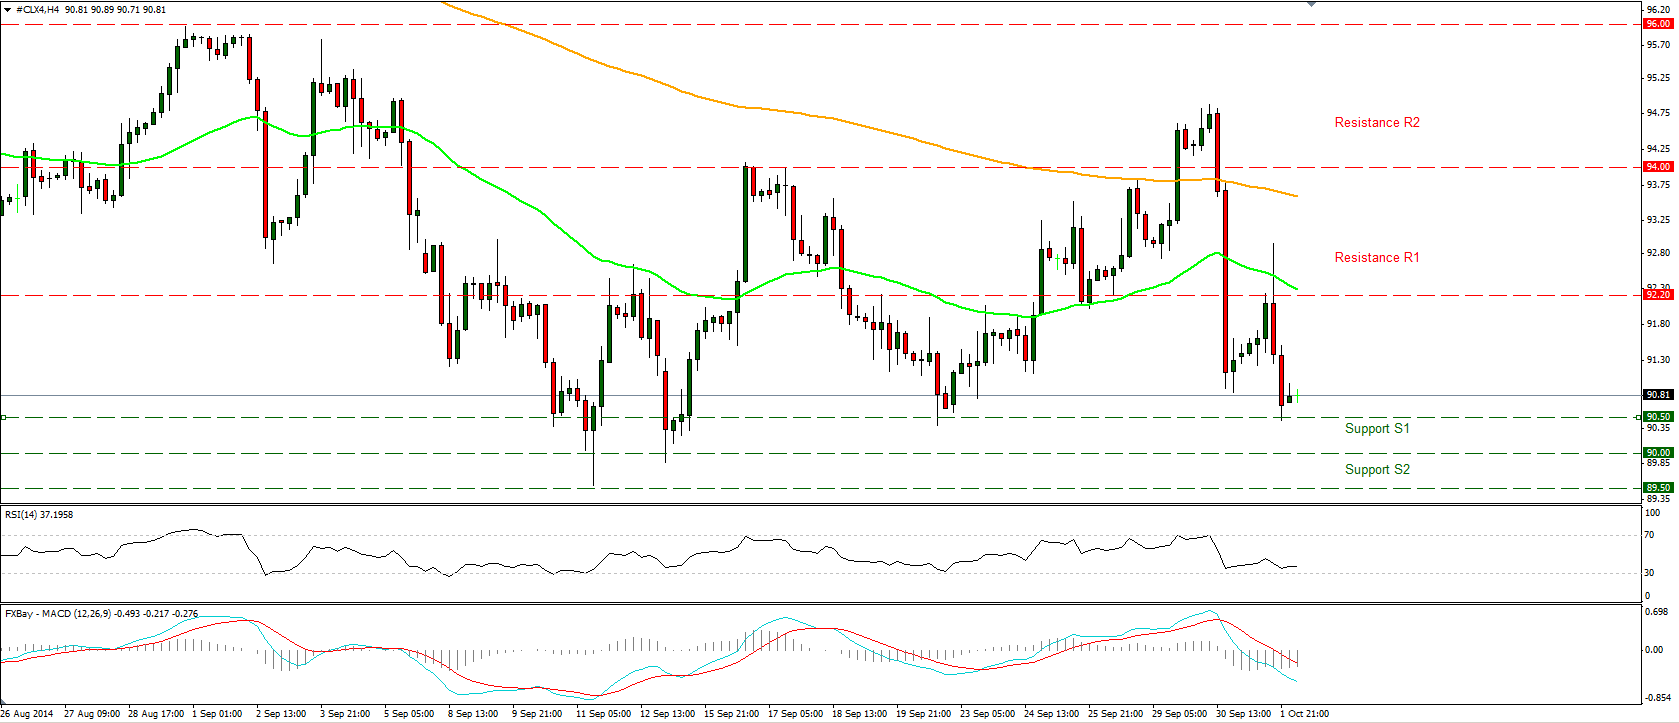
WTI declined yesterday after finding resistance at 92.20 (R1), but the move was halted as soon as the price reached the 90.50 (S1) support area. As long as the price structure does not suggest trending conditions, I would prefer to maintain my neutral stance. The MACD lies below both its signal and zero lines, while the RSI found support just above its 30 line and is pointing up. These mixed momentum signals give me another reason to remain neutral, at least for now.
• Support: 90.50 (S1), 90.00 (S2), 89.50 (S3).
• Resistance: 92.20 (R1), 94.00 (R2) , 96.00 (R3).
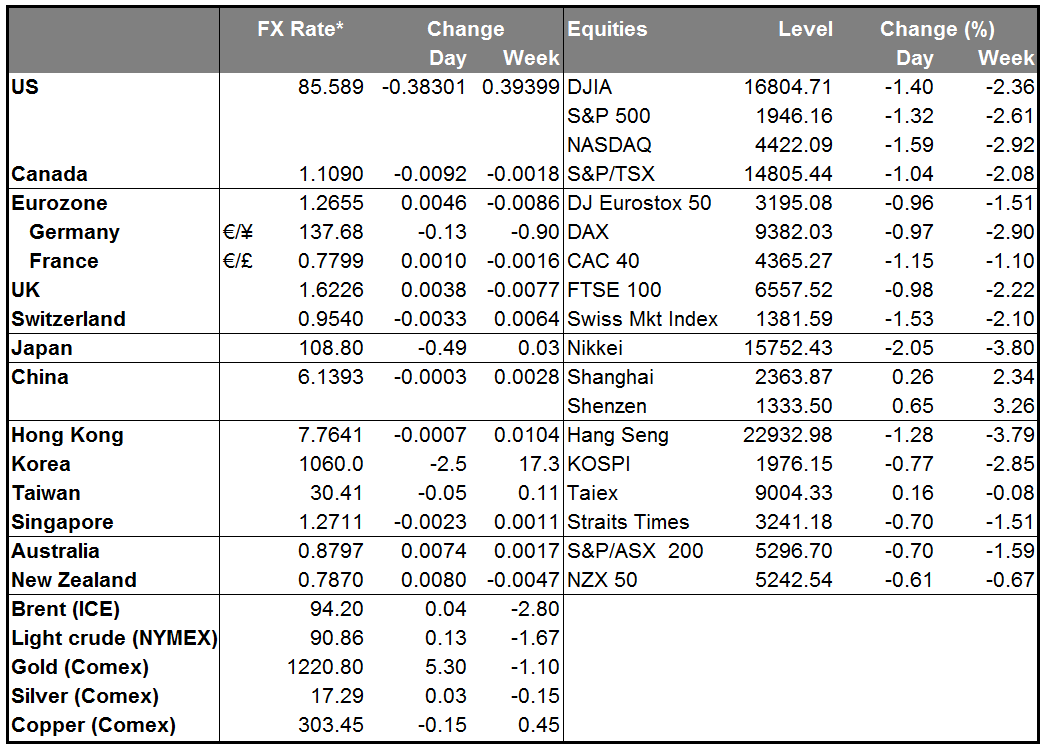
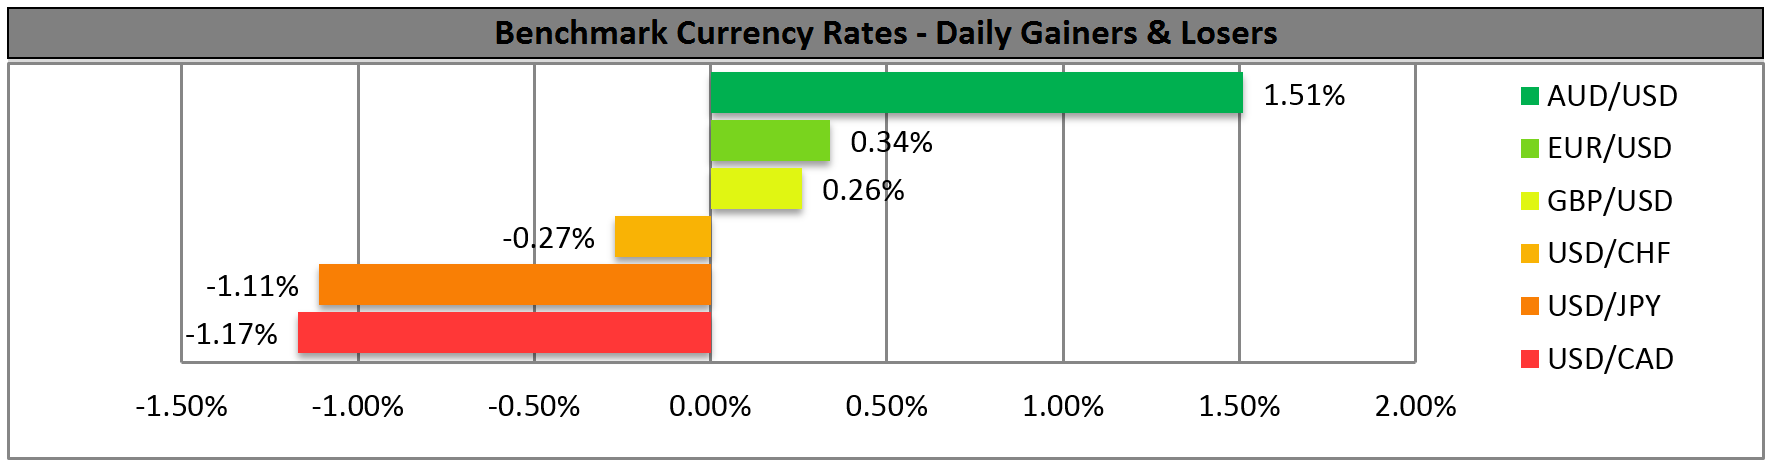
BENCHMARK CURRENCY RATES - DAILY GAINERS AND LOSERS
MARKETS SUMMARY