EUR/USD breaks below 1.3152
EUR/USD fell below 1.3152 (support turned into resistance), the lower boundary of the range it’s been trading in since the 25th of August. I would now expect the rate to find support at 1.3100 (S1), the lows of the 6th of September 2013, or near the lower boundary of the blue downside channel, connecting the lows and the highs on the daily chart. Although the overall picture remains to the downside, I will take the sidelines as soon as the rate reaches the aforementioned support area. The possibility of a corrective bound near the lower bound of the channel remains high, so I will wait for the market reaction once the price is near that zone. If the bears ignore these support lines and continue pushing the rate lower, we are likely to see extensions towards the psychological zone of 1.3000 (S2).
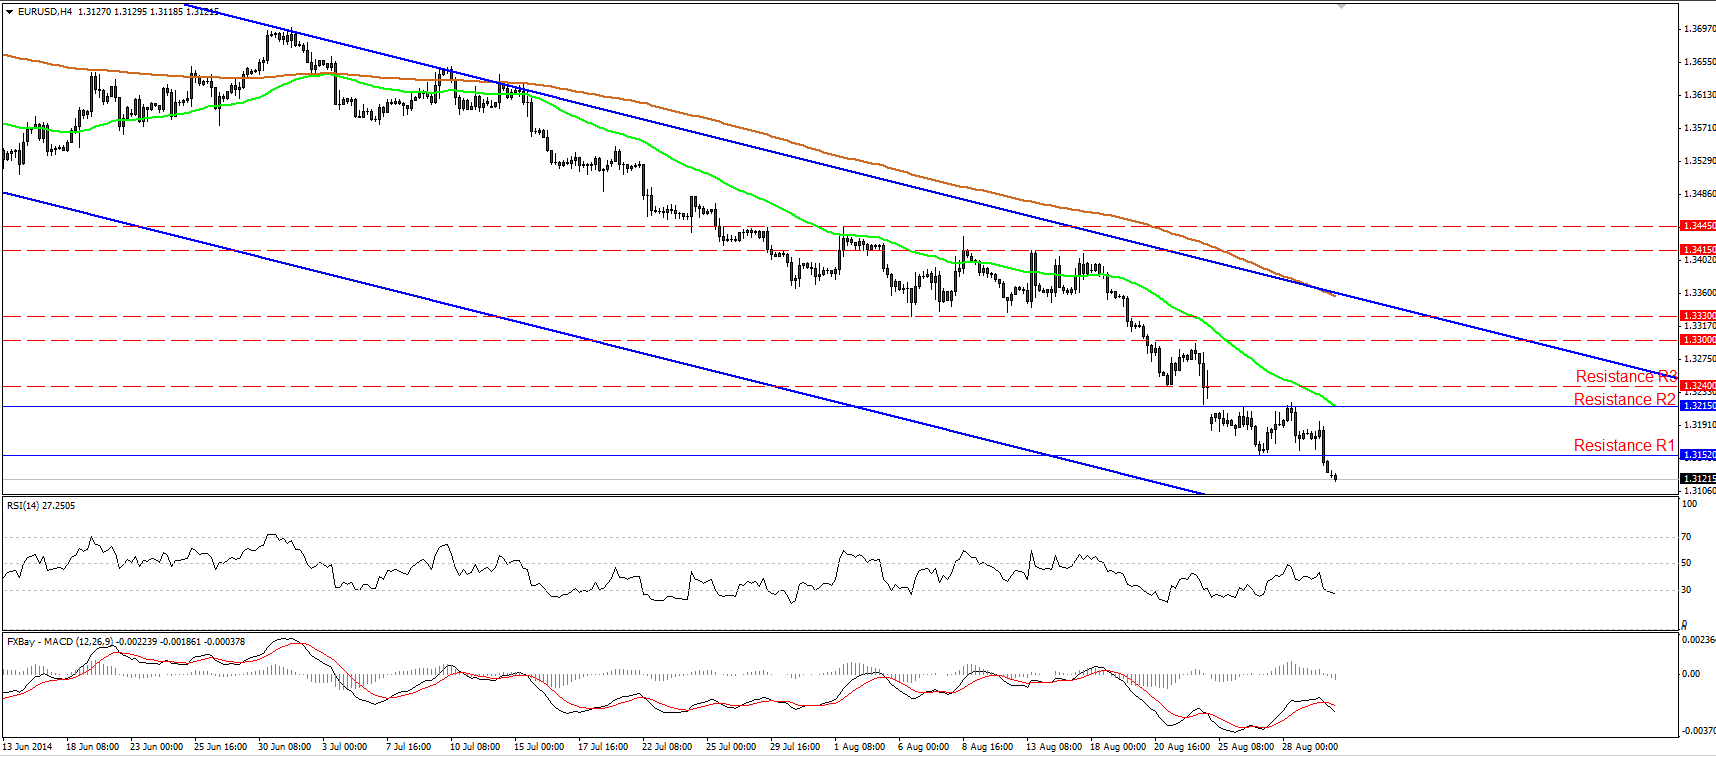
• Support: 1.3100 (S1), 1.3000 (S2), 1.2900 (S3).
• Resistance: 1.3152 (R1), 1.3215 (R2), 1.3240 (R3).
Is USD/JPY resuming its long-term uptrend?
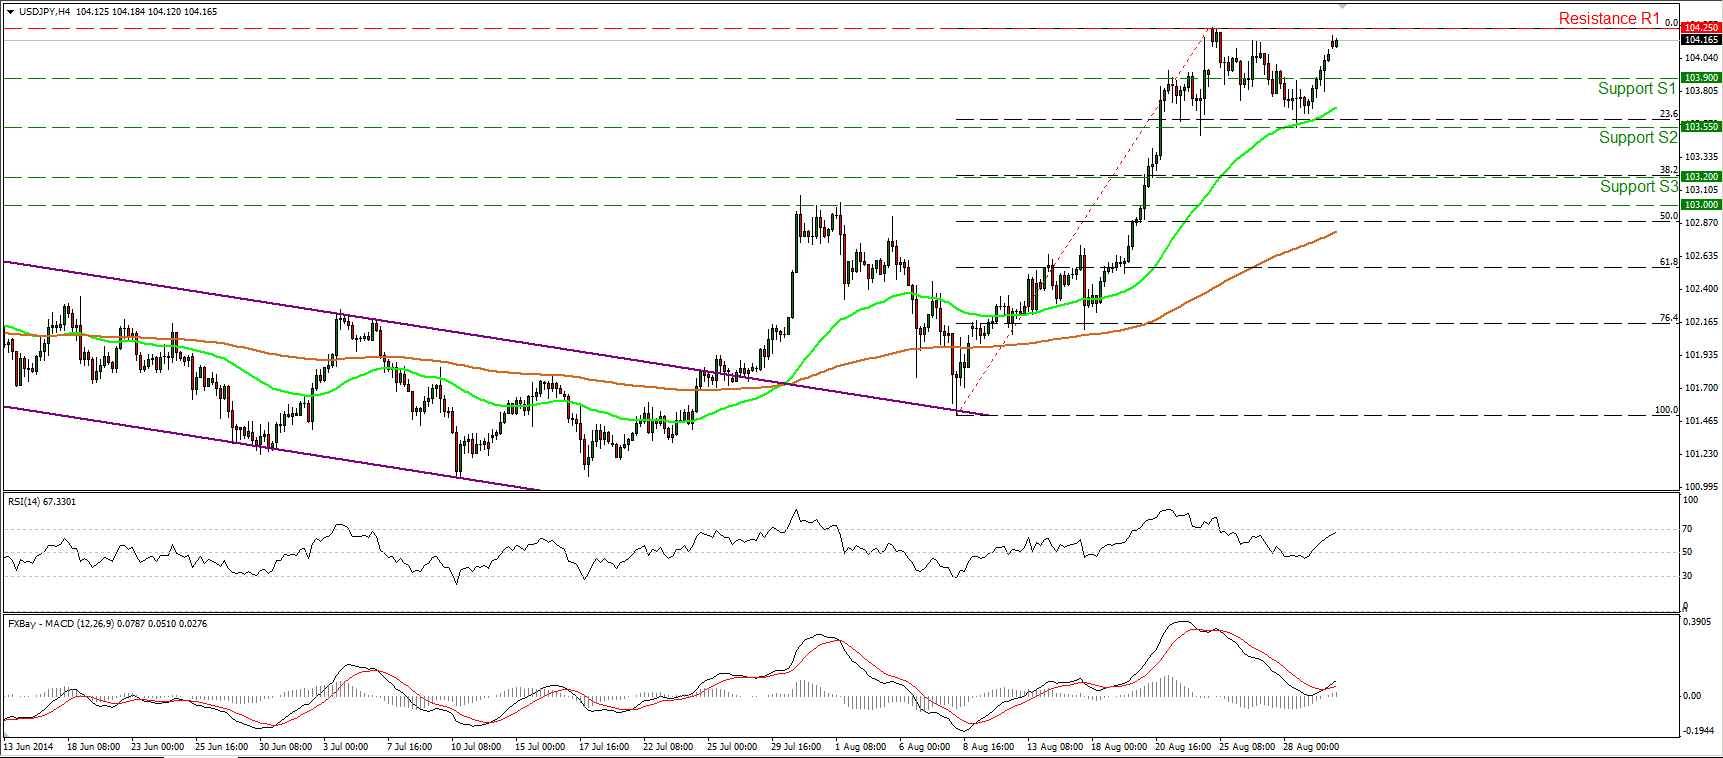
USD/JPY climbed above 104.00 again, after finding strong support at the 103.55 (S2) barrier, near the 23.6% retracement level of the 8th – 25th August upside wave. Today, during the early European morning, the rate is trading slightly below the recent highs of 104.25 (R1). I still believe that a clear move above that line could set the stage for extensions towards our next resistance hurdle, at 104.85 (R2), defined by the high of the 23rd of January. In the bigger picture, I still see a newborn long-term uptrend, since the price structure remains higher highs and higher lows above both the 50- and the 200-day moving averages.
• Support: 103.90 (S1), 103.55 (S2), 103.20 (S3).
• Resistance: 104.25 (R1), 104.85 (R2), 105.00 (R3).
GBP/USD testing the downtrend line
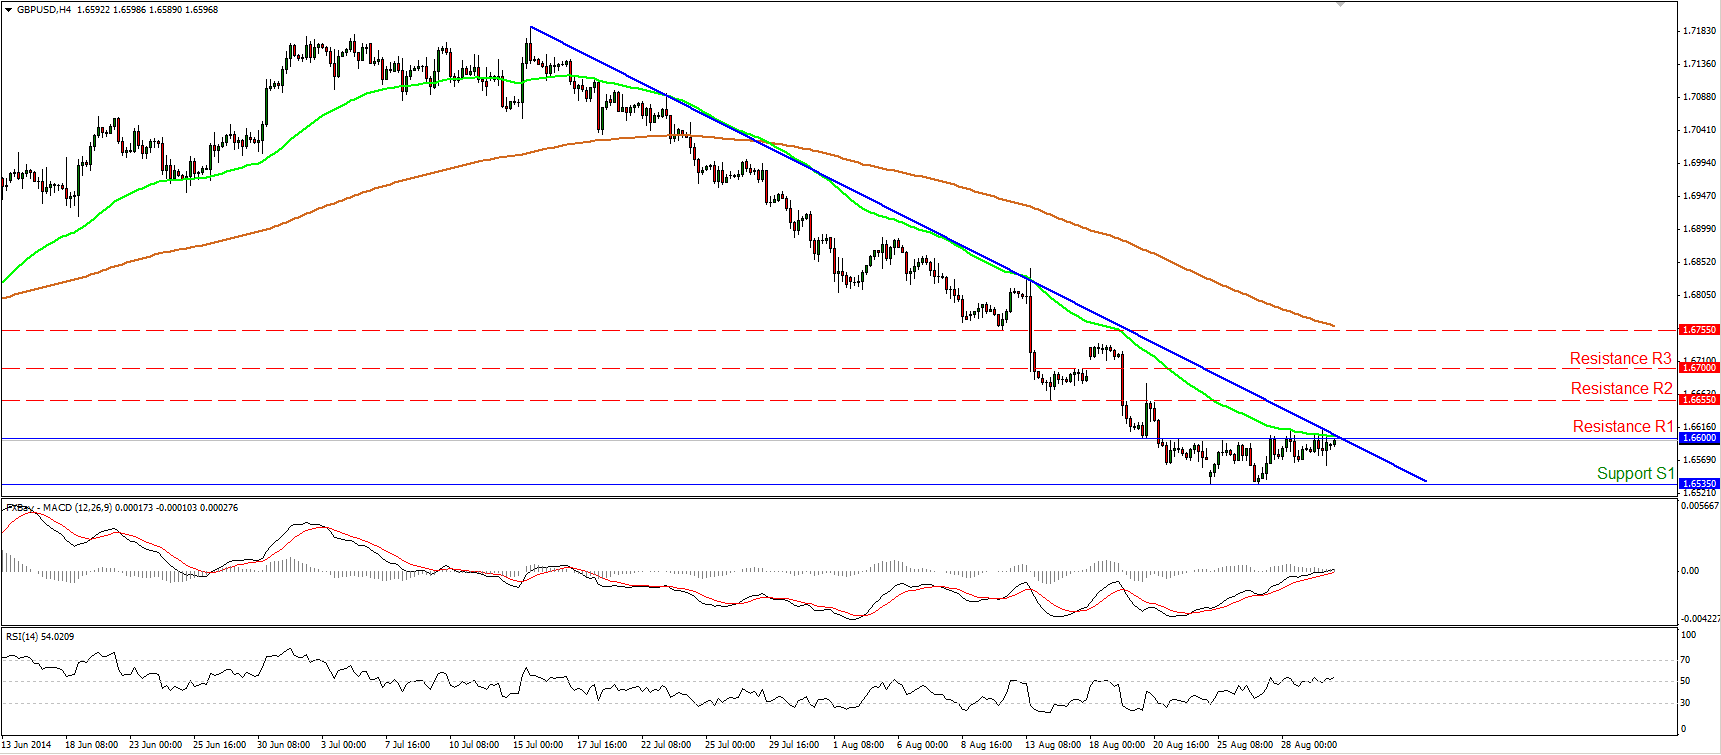
GBP/USD continued ranging between the support line of 1.6535 (S1) and the resistance of 1.6600 (R1). At the time of writing, the rate is ready to challenge the point of intersection between the 1.6600 (R1) line and the downtrend line drawn from the highs of the 15th of July. A clear move above 1.6600 is likely to signal the beginning of a corrective phase and could challenge our next resistance obstacle at 1.6655 (R2), first. On the other hand, we need to see a dip below 1.6535 (S1) to have a forthcoming lower low and the continuation of the downtrend. In the bigger picture, Cable remains below the 80-day exponential moving average, the moving average that supported the lows of the price action for a whole year. As a result, the overall outlook remains negative in my view, and I would see any possible bullish moves as corrective waves.
• Support: 1.6535 (S1), 1.6460 (S2), 1.6350 (S3).
• Resistance: 1.6600 (R1), 1.6655 (R2), 1.6700 (R3).
Gold in a consolidative move
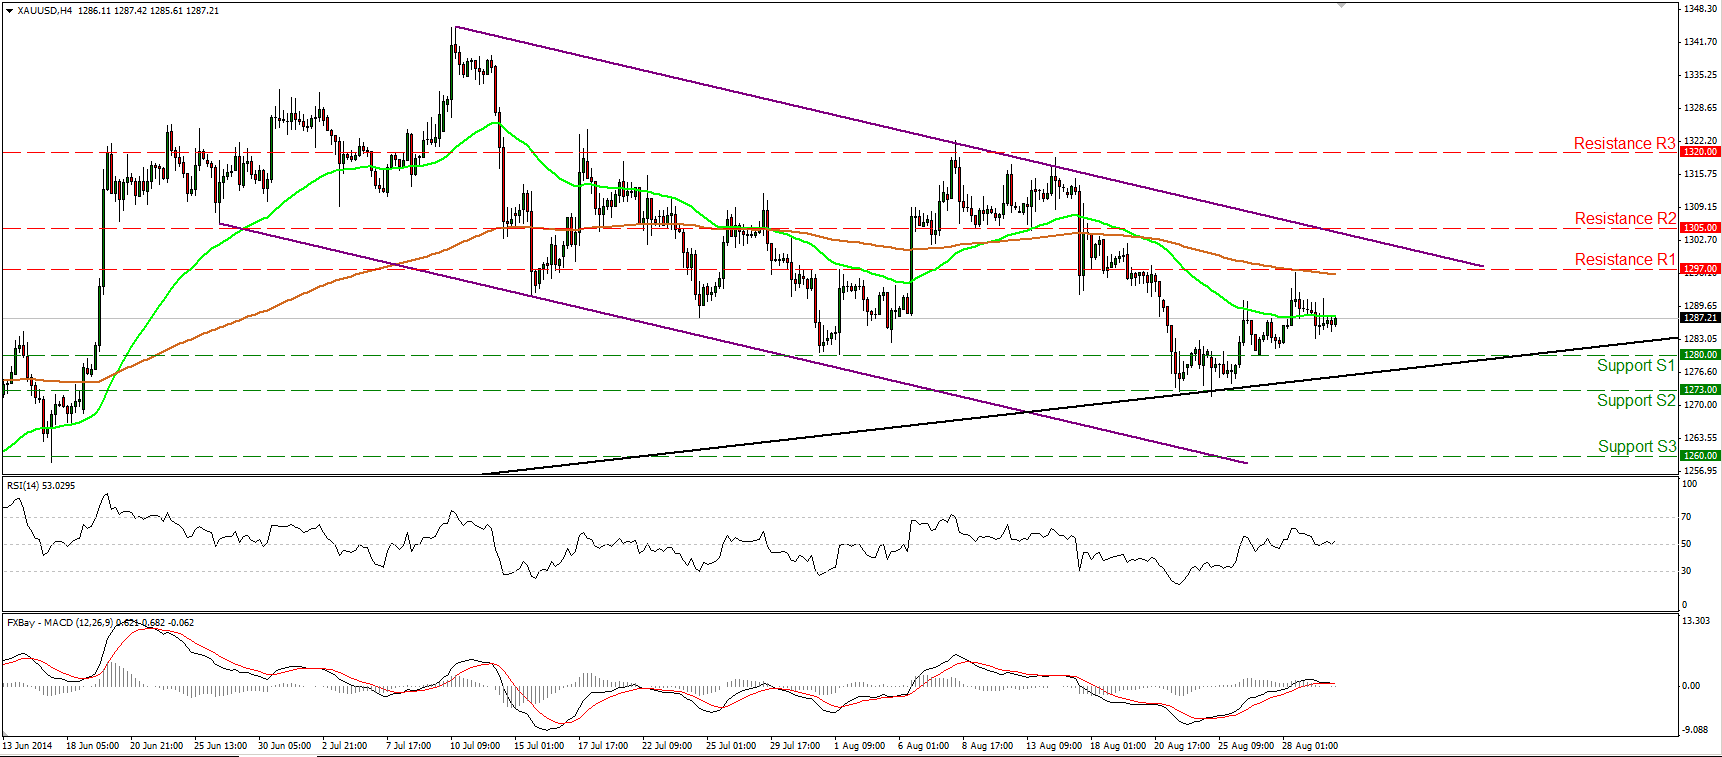
Gold moved sideways on Friday, remaining between the support line of 1280 (S1) and the resistance of 1297 (R1). Both the RSI and the MACD lie near their neutral lines, confirming investors’ reluctance to choose a direction. The possibility for a higher low still exists though and as a result I consider the near term picture to be cautiously to the upside. However, the yellow metal is still trading within the purple downside channel, connecting the lows and the highs on the daily chart, thus I would see any possible upside waves as a corrective move, at least for now.
• Support: 1280 (S1), 1273 (S2), 1260 (S3).
• Resistance: 1297 (R1), 1305 (R2), 1320 (R3).
WTI breaks above 95.00
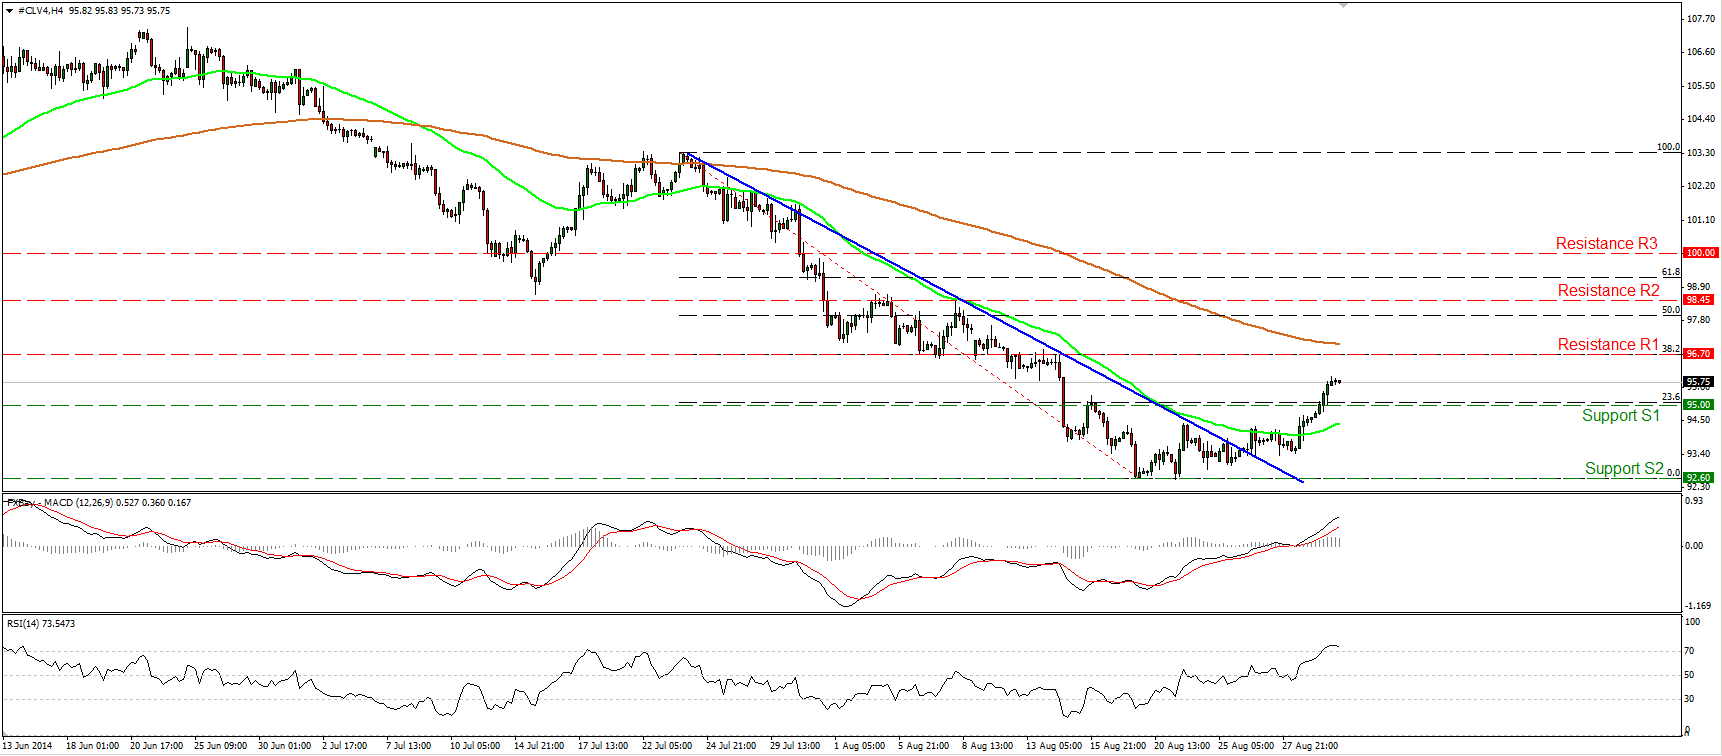
WTI continued moving higher on Friday, violating the psychological barrier of 95.00 (resistance turned into support), which lies near the 23.6% retracement level of the 23rd July – 19th August downtrend. I will stick to the view that such a break is likely to target our next resistance, at 96.70 (R1), which coincides with the 38.2% retracement level of the aforementioned down move. The MACD lies above both its zero and signal lines, confirming the recent strong positive momentum, but the RSI lies within its overbought zone, pointing down. Bearing our momentum signs in mind, I would be cautious of a pullback before the longs take control again, perhaps to challenge the 95.00 (S1) zone as a support this time. On the daily chart, the 14-day RSI moved higher, and is now slightly below its 50 line, while the daily MACD, although negative, lies above its trigger. This corroborates my view that we are likely to see further bullish moves, at least towards our first resistance, at 96.70 (R1).
• Support: 95.00 (S1), 92.60 (S2), 91.60 (S3).
• Resistance: 96.70 (R1), 98.45 (R2), 100.00 (R3).
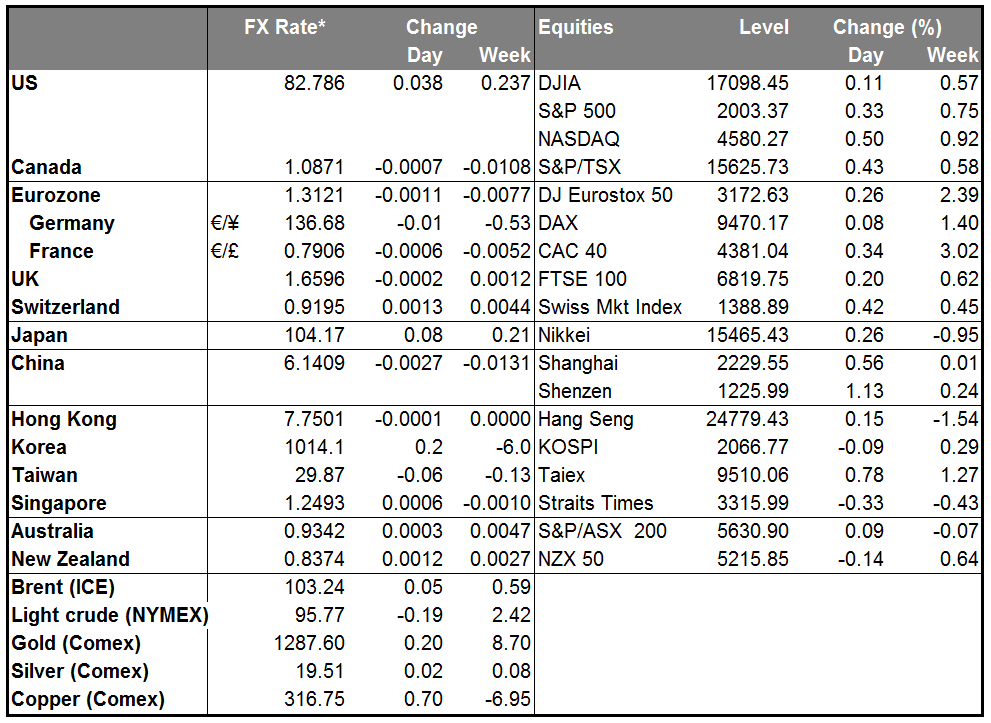
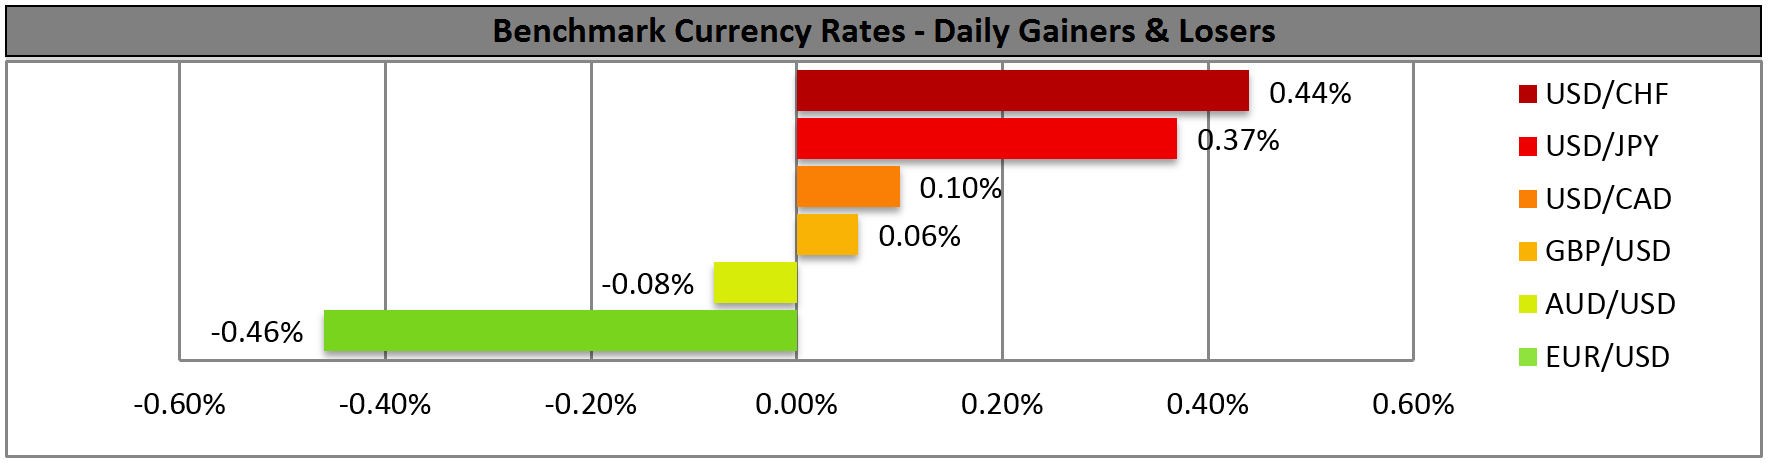
BENCHMARK CURRENCY RATES - DAILY GAINERS AND LOSERS
MARKETS SUMMARY