Car output growth in China and Japan
Higher demand for gold and other precious metals is seen on weaker US dollar. Investors consider precious metals as an alternative to US assets. The review on gold has been released recently. Will palladium prices advance?
Presidential elections in US are due on November 8. Some market participants believe the Republican Donald Trump is less interested in rate hike than Democrat Hillary Clinton. Higher Fed interest rates support the US dollar and push gold prices lower. Prices for these assets are as usual negatively correlated. US dollar index continued weakening on Friday on weak data on US labour market for October. Nonfarm payrolls rose twice less than previously expected. Precious metals advanced respectively. We believe palladium prices may gain additional positive from reviving car industry as the metal is actively used to produce car catalysts. Automobile industry accounts for around 75% of demand for palladium. The car production in Japan rose 1.4% in September 2016 while car exports rose 3.8% compared to previous September, according to Japan Automobile Manufacturers Association. 840.9 thousand cars have been produced in Japan in 9 months of this year with 435 thousand exported. Much higher increased was in evidence in China. 2.6mln cars have been produced in September 2016 which is 26.1% above the same period of previous year. The production increased 13.2% in 3 quarters of 2016.

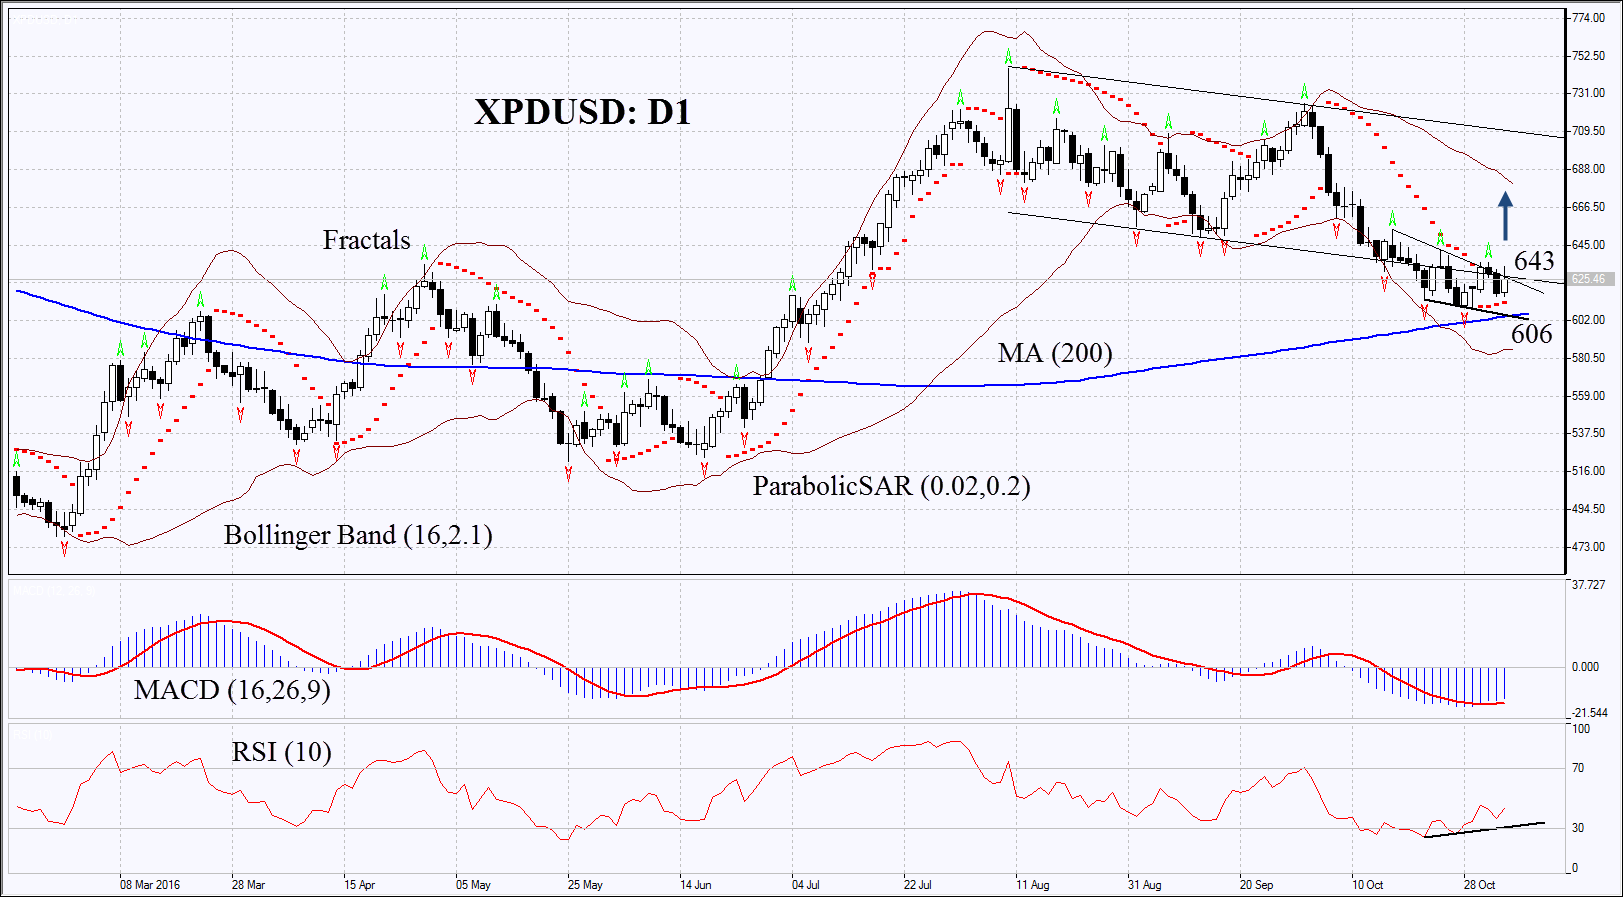
On the daily chart XPDUSD: D1 is struggling for returning top previous downward channel. Such a movement may be seen as upward correction. Further increase is possible in case of higher demand from world automakers and in case of higher prices for all precious metals.
- Parabolic gives bullish signal.
- Bollinger bands have widened which means higher volatility.
- RSI is below 50. It has left the oversold zone having formed positive divergence.
- MACD gives bullish signals.
The bullish momentum may develop in case palladium surpasses the two last fractal highs and returns to the previous price channel at 643. This level may serve the point of entry. The initial stop-loss may be placed below the last fractal low, Parabolic signal and the 200-day moving average at 606. Having opened the pending order we shall move the stop to the next fractal low following the Parabolic and Bollinger signals. Thus, we are changing the probable profit/loss ratio to the breakeven point. The most risk-averse traders may switch to the 4-hour chart after the trade and place there a stop-loss moving it in the direction of the trade. If the price meets the stop-loss level at 606 without reaching the order at 643, we recommend cancelling the position: the market sustains internal changes which were not taken into account.
Summary of technical analysis:
| Position | Buy |
| Buy stop | above 643 |
| Stop loss | below 606 |
