
Shanghai Gold Exchange to cut limit per trade
World largest physical gold trading exchange Shanghai Gold Exchange will cut the gold limit per trade since January 1, 2017 for some contracts from 1 tonne to 500kg. The step is taken to limit the influence of institutional investors, mainly banks and hedge funds, on the prices. Will gold advance?
The aim of changes is for traders to split big orders and to make trades by parts. At the same time the daily volume of gold trading will be unlimited. The record high volume of trading gold for this year was hit this November at Shanghai Gold Exchange being 3.4mln kg. After the victory of Republican Donald Trump in US presidential elections gold slumped around 12%. Two weeks ago it hit a fresh 110month low. Holdings in world’s largest gold trading ETF SPDR Gold Trust dipped 13% to 823.4 tonnes after US elections. The net longs in gold at COMEX exchange fell for 6th straight week amid such negative trend, according to the US Commodity Futures Trading Commission. Nevertheless, gold steadied in recent couple of days rising above the psychological level of $1100 an ounce. Some countries and big investors may cut their investments in US treasuries to buy gold. It sounds logical as the Fed is planning to go on with rising interest rates. This pushes bond prices lower and raises the bond yields. In particular, in 12 months to October 2016 China sold US treasuries worth $403bn. Its total forex reserves fell 8% in January-November 2016 while the volume of US treasuries fell almost 26%. At the same time, Chinese reserves of physical gold managed to rise about 4.5%.
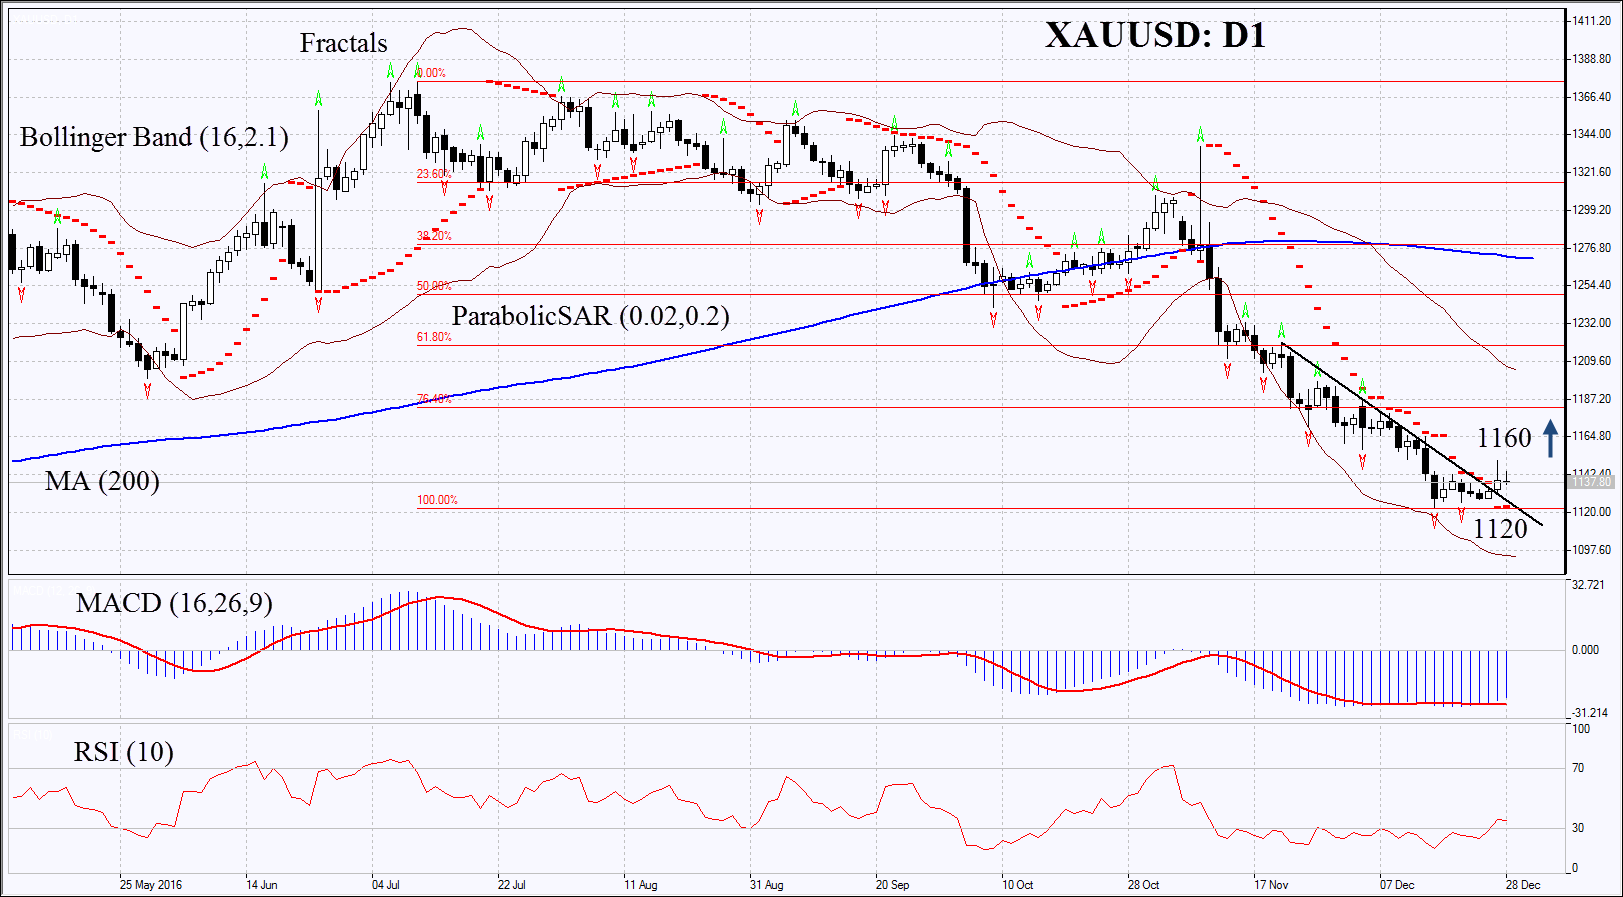
On the daily chart XAUUSD: D1 is correcting upwards from the 11-month low. Further price increase is possible in case of higher demand for gold, weak economic data in US and higher political risks.
- The Parabolic indicator gives bullish signal.
- The Bollinger bands have widened which means higher volatility.
- The RSI is below 50 having left the oversold zone, no divergence.
- The MACD gives bullish signal.
The bullish momentum may develop in case gold surpasses the last fractal high at 1160. This level may serve the point of entry. The initial stop-loss may be placed below the two last fractal lows, the trend line and the Parabolic signal at 1120. Having opened the pending order we shall move the stop to the next fractal low following the Parabolic and Bollinger signals. Thus, we are changing the probable profit/loss ratio to the breakeven point. The most risk-averse traders may switch to the 4-hour chart after the trade and place there a stop-loss moving it in the direction of the trade. If the price meets the stop-loss level at 1120 or 1100 without reaching the order at 1160, we recommend cancelling the position: the market sustains internal changes which were not taken into account.
Summary of technical analysis:
| Position | Buy |
| Buy stop | above 1160 |
| Stop loss | below 1120 or 1100 |