
Gold and US dollar index took no notice of US GDP growth
Gold advanced on Friday while US dollar for Q3 fell despite strong US GDP data for Q3. Majority of investors believe the Fed is to hike the interest rate on December 14 but its next hike may be not soon after that. Will gold prices continue advancing?
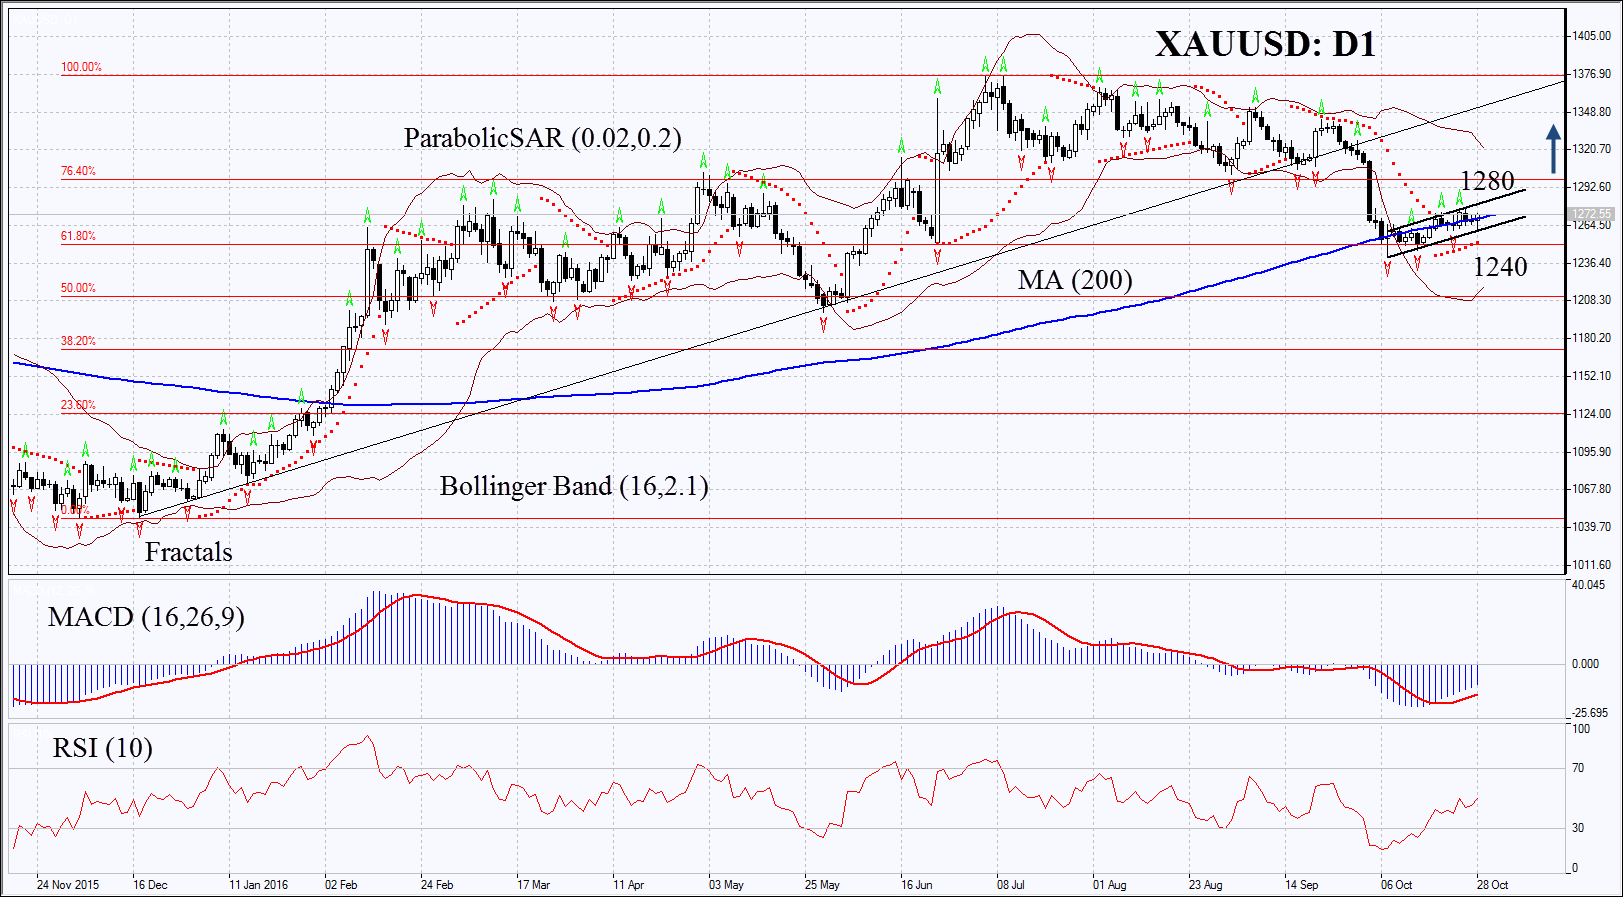
On the daily chart XAUUSD: D1 is within the rising channel. It has surpassed the 200-day moving average. Further growth is possible in case of higher demand from world central banks and major hedge funds together with their lower demand for dollar assets.
- Parabolic is giving bullish signal.
- Bollinger bands are narrowing which means lower volatility.
- RSI is above 50 but is far from overbought zone. No divergence.
- MACD is giving bullish signals.
The bullish momentum may develop in case gold surpasses the last fractal high and resistance of the rising trend at 1280. This level may serve the point of entry. The initial stop-loss may be placed below the three last fractal lows and 5-month low at 1240. Having opened the pending order we shall move the stop to the next fractal low following the Parabolic and Bollinger signals. Thus, we are changing the probable profit/loss ratio to the breakeven point. The most risk-averse traders may switch to the 4-hour chart after the trade and place there a stop-loss moving it in the direction of the trade. If the price meets the stop-loss level at 1240 without reaching the order at 1280, we recommend cancelling the position: the market sustains internal changes which were not taken into account.
Summary of technical analysis:
| Position | Buy |
| Buy stop | above 1280 |
| Stop loss | below 1240 |