
New technologies may raise demand for silver
Demand for silver may rise due to new industrial technologies, according to GFMS and The Silver Institute. Will silver edge up?
PDemand for silver to produce the film tumbled 3 times in recent 10 years. At the same time, the demand for silver for photovoltaics soared roughly the same. It increased 23% last year compared to 2014. Global political and economic instability make people use silver for investment objectives. Thus, production of silver coins and bullions has increased from 10mln ounces to 300mln ounces in recent 10 years. The global increase in demand is being anticipated due to developing technologies of “Internet of things”, OLED sources of light, jewellery and clothing emblems production, in aerospace industry and in nanotechnologies. At the same time, global silver production steadied at +2% in recent 2 years having increased 38% in recent 10 years. Nevertheless, despite such a significant rise in production volumes, high demand for silver pushed its prices up almost twofold. Historically, silver prices copy gold price fluctuations. In 1975-2015 average ratio of gold to silver was 55.4. Now it reached 70.7, which may signify that silver is lagging behind.
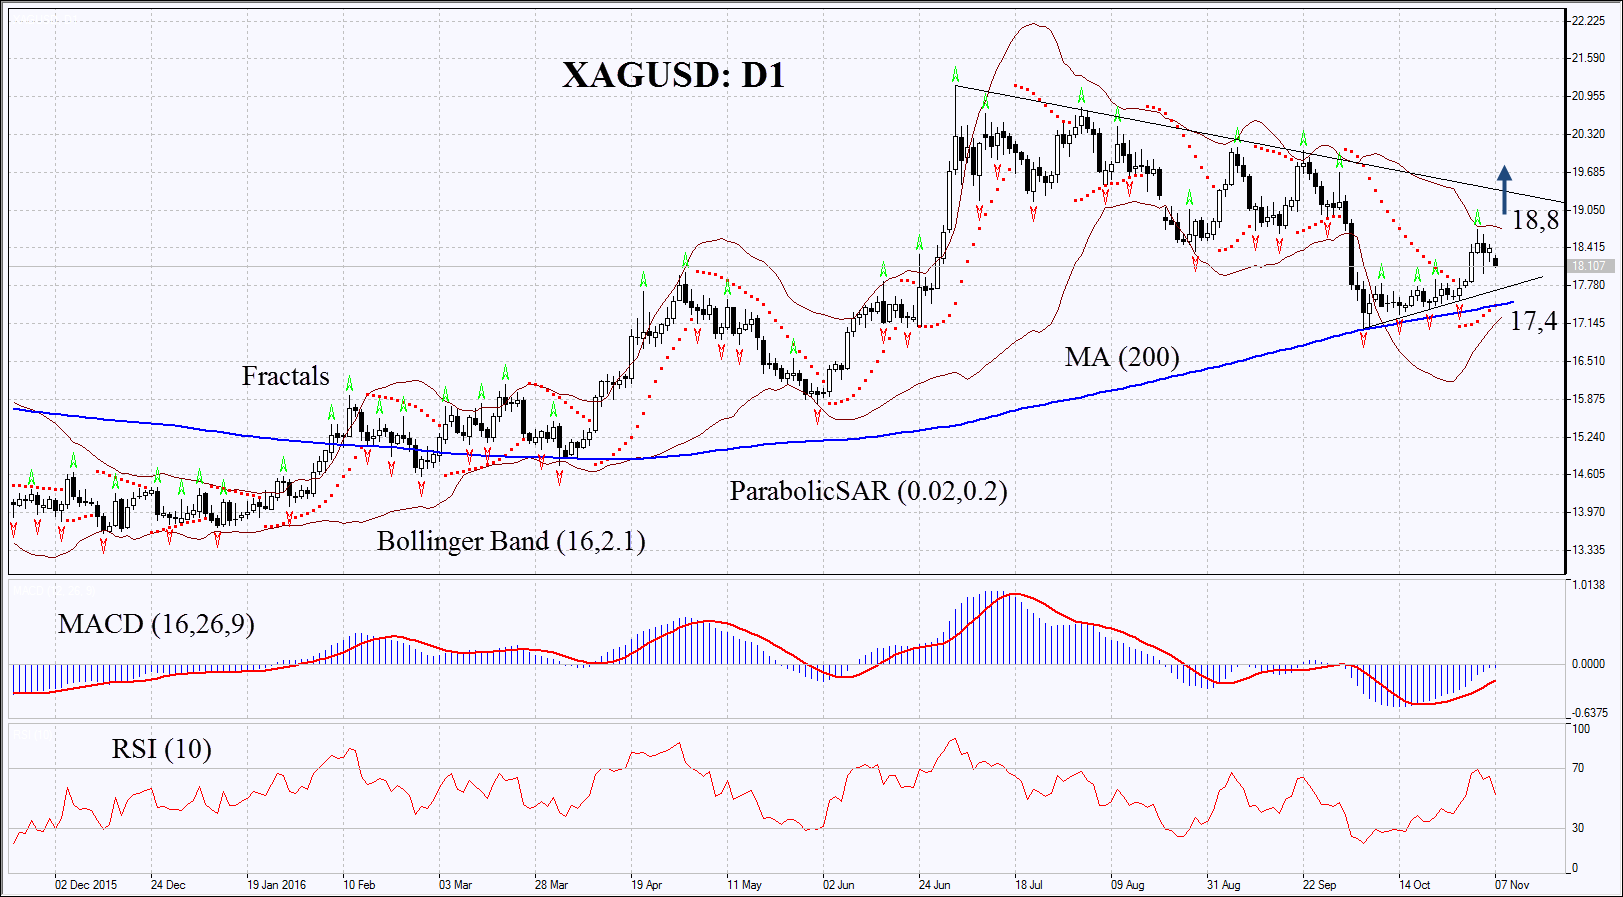
On the daily chart XAGUSD: D1 is rising from its 200-day moving average through which it failed to break down about a month ago. Further growth is possible in case of general increase in precious metals and gold prices as well as in case of higher demand from global industry and producers of solar batteries.
- Parabolic gives bullish signals.
- Bollinger bands have contracted which means lower volatility.
- RSI is above 50. It has left overbought zone, no divergence.
- MACD gives bullish signals.
The bullish momentum may develop in case silver surpasses the last fractal high and upper Bollinger band at 18.8. This level may serve the point of entry. The initial stop-loss may be placed below the Parabolic signal, the 200-day moving average and the last fractal low at 17.4. Having opened the pending order we shall move the stop to the next fractal low following the Parabolic and Bollinger signals. Thus, we are changing the probable profit/loss ratio to the breakeven point. The most risk-averse traders may switch to the 4-hour chart after the trade and place there a stop-loss moving it in the direction of the trade. If the price meets the stop-loss level at 17.4 without reaching the order at 18.8, we recommend cancelling the position: the market sustains internal changes which were not taken into account.
Summary of technical analysis:
| Position | Buy |
| Buy stop | above 18.8 |
| Stop loss | below 17.4 |