
Retracement ahead of presidential elections
US dollar index is correcting down amid higher political risks ahead of US presidential elections which are scheduled on November 8, 2016. Investors are concerned with the FBI investigation on Democratic candidate Hillary Clinton emails. Will US currency continue weakening?
UD GDP for Q3 2016 rose 2.9% ion annual terms after the 1.4% rise in Q2. This is above the consensus forecast of +2.6%. Nevertheless, US dollar index edged lower which pushed up gold prices. As a rule, these to assets are negatively correlated. Investors consider gold to be an alternative to investments in US currency and financial instruments. The main reason for disregard of strong GDP data may be weak reaction of interest rate futures. The chances for the Fed rate hike at December meeting are almost unchanged at just below 80%, according to FedWatch. Additional negative was the lower Consumer confidence index by Michigan University for October while its increase was anticipated. According to consensus-forecast, the average gold price is to reach $1300 per ounce in Q4 2016 and $1331 in 2017. Meanwhile such banks and companies as Bank of America Merrill Lynch, RBC Capital Markets, JPMorgan and some others believe the average gold price may be much higher next year near $1500 an ounce. So they forecast the average gold price to be around $1400 an ounce in Q4. This is far above the current prices.
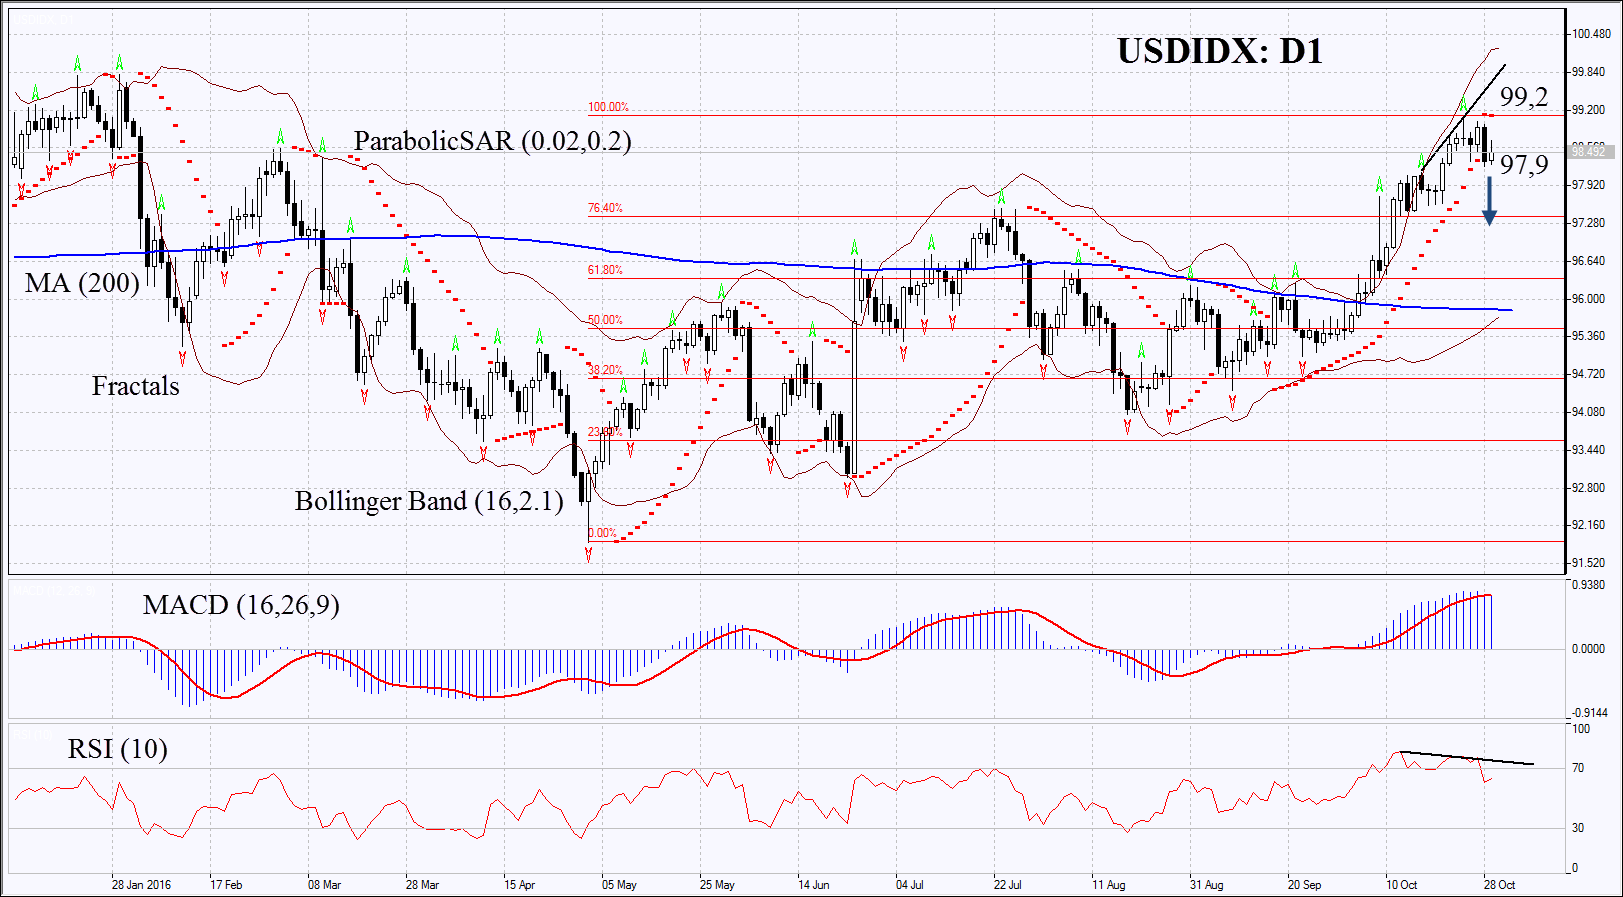
On the daily chart USDIDX: D1 is correcting down. Further decline is possible in case of higher political risks ahead of elections and in case of weak US economic indicators.
- Parabolic is giving bearish signals.
- Bollinger bands have widened a lot which means extremely high volatility.
- RSI is above 50. It has left the overbought zone having formed negative divergence.
- MACD is giving bullish signals.
The bearish momentum may develop in case US dollar index falls below the Friday low at 97.9. This level may serve the point of entry. The initial stop-loss may be placed above the Parabolic signal, the last fractal high and 9-month high at 99.2. Having opened the pending order we shall move the stop to the next fractal high following the Parabolic and Bollinger signals. Thus, we are changing the probable profit/loss ratio to the breakeven point. The most risk-averse traders may switch to the 4-hour chart after the trade and place there a stop-loss moving it in the direction of the trade. If the price meets the stop-loss level at 99.2 without reaching the order at 97.9, we recommend cancelling the position: the market sustains internal changes which were not taken into account.
Summary of technical analysis:
| Position | Sell |
| Sell stop | below 97.9 |
| Stop loss | above 99.2 |