
Awaiting economic data in Canada
Significant economic data will come out in Canada on Thursday and Friday: inflation for November and retail sales for October as well as the October GDP. The tentative outlook is negative. Will Canadian dollar continue weakening? It looks as growth on USDCAD chart.
Data will come out at 14-30 СЕТ. Retail sales and consumer price index are expected to fall. GDP will come out on Friday and may be lower. Moreover, several other factors may have negative effect on Canadian dollar. The current rate of Bank of Canada is 0.5%. This is below the US Fed rate which was raised to 0.75% last week. The next Bank of Canada meeting will take place on January 18, 2017 while the Fed meeting is scheduled on February 1. New US president Donald Trump is going to reconsider terms of NAFTA. Market participants are concerned that this may have a negative effect on Canadian economy. Last week the president of Bank of Canada Stephen Poloz attempted to calm investors by saying that Canadian export is unlikely to suffer under Trump’s presidency. At the same time, he criticized the rising global protectionism. Investors, in their turn, decided that Canadian economy may need monetary stimulus. In such conditions Bank of Canada will not soon follow the Fed and will think twice before rate hike. This Monday on December 26, 2016 the markets in Canada will be closed on Christmas holiday.
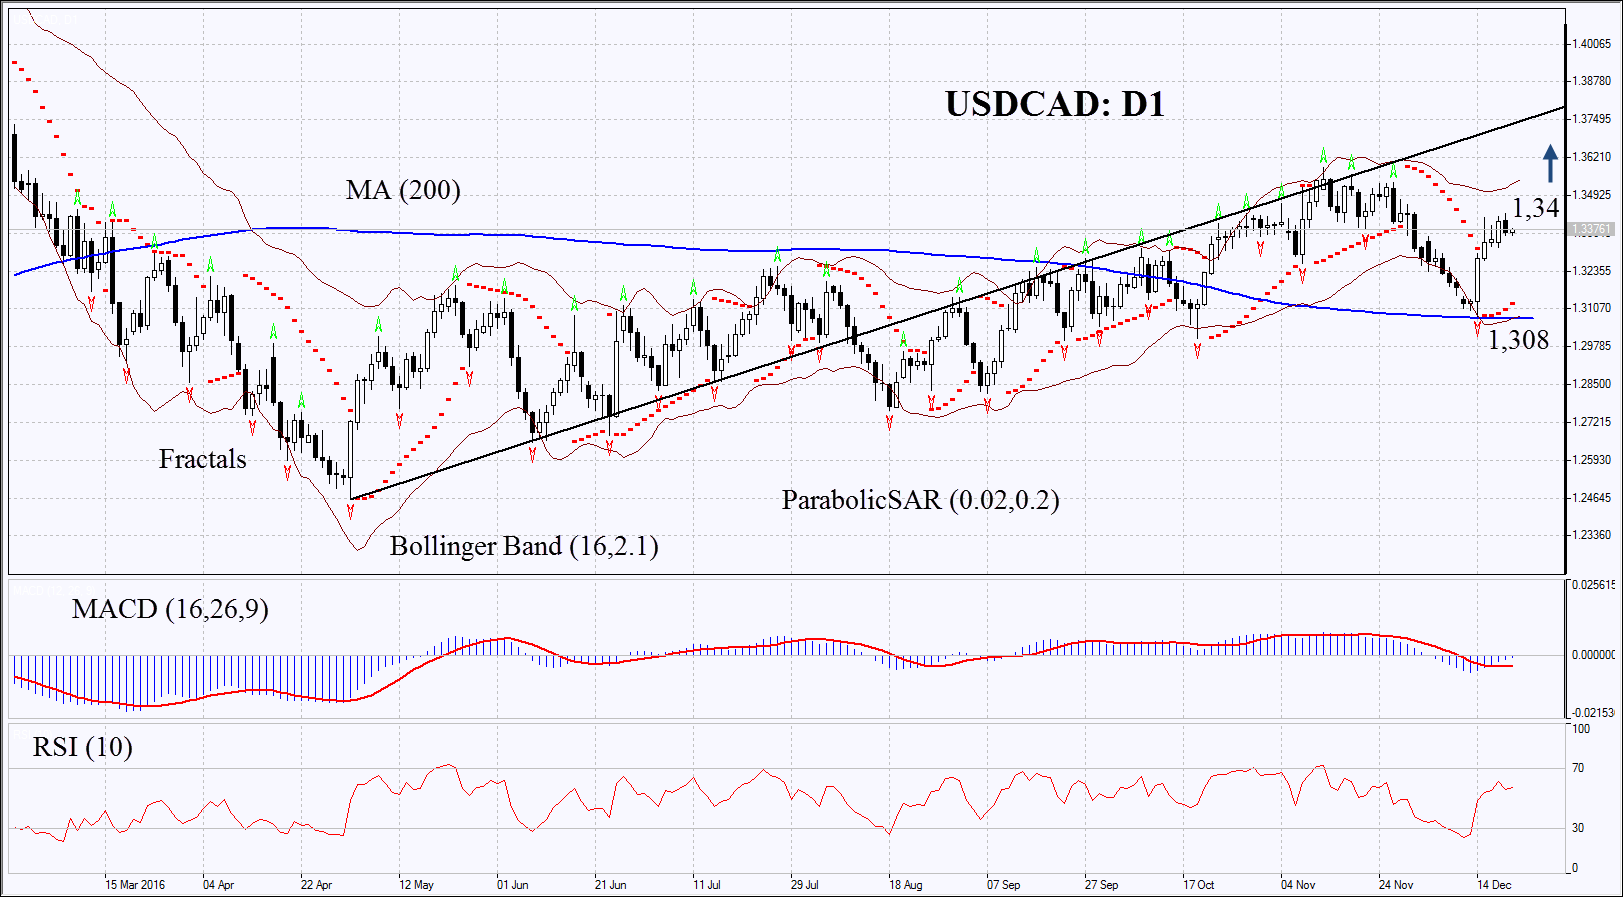
On the daily chart USDCAD: D1 is in the range. It has reached its 200-day moving average, failed to break down through it and started correcting upwards. Further price increase is possible in case of weak economic data in Canada on Thursday and Friday.
- Parabolic indicator gives bullish signal.
- Bollinger bands have widened which means higher volatility. They are tilted upwards.
- RSI is above 50, no divergence.
- MACD gives bullish signal.
The bullish momentum may develop in case Canadian dollar surpasses the last fractal high at 1.34. This level may serve the point of entry. The most risk-averse traders may wait for economic data and make a deal in case the data turn out to be negative. The initial stop-loss may be placed below the Parabolic signal, the Bollinger band, the last fractal low and the 200-day moving average at 1.308. Having opened the pending order we shall move the stop to the next fractal low following the Parabolic and Bollinger signals. Thus, we are changing the probable profit/loss ratio to the breakeven point. The most risk-averse traders may switch to the 4-hour chart after the trade and place there a stop-loss moving it in the direction of the trade. If the price meets the stop-loss level at 1.308 without reaching the order at 1.34, we recommend cancelling the position: the market sustains internal changes which were not taken into account.
Summary of technical analysis:
| Position | Buy |
| Buy stop | above 1.34 |
| Stop loss | below 1.308 |