
Chances for further rate cut fall
Strong labour market data for October came out in Canada. Currency market shrugged of them ahead of US elections but the chances for further rate cut in Canada finally fell on Wednesday. WillCanadian dollar strengthen?
Unemployment in Canada remained at 7% in October 2016 but job openings rose by 43.9 thousand. This is far above their expected decline by 15 thousand. Bank of Canada supports the interest rate of 0.5% since last July. The chances for its further decline after the labour market report for October fell from 33% to 20%. The next Bank of Canada meeting will take place on December 7, 2016. After Republican Donald Trump won at US presidential elections, Canadian dollar hit a fresh 8-month low. Investors worry Trump may want to revise the NAFTA trade agreement. This may weaken the Canadian currency and is the major risk for her. Positive factor is higher oil, grains and metal prices which account for a large part of Canada’s export. The next significant economic data will come out in Canada on November 18 – inflation for October. Stronger Canadian dollar looks as decline in USDCAD chart.
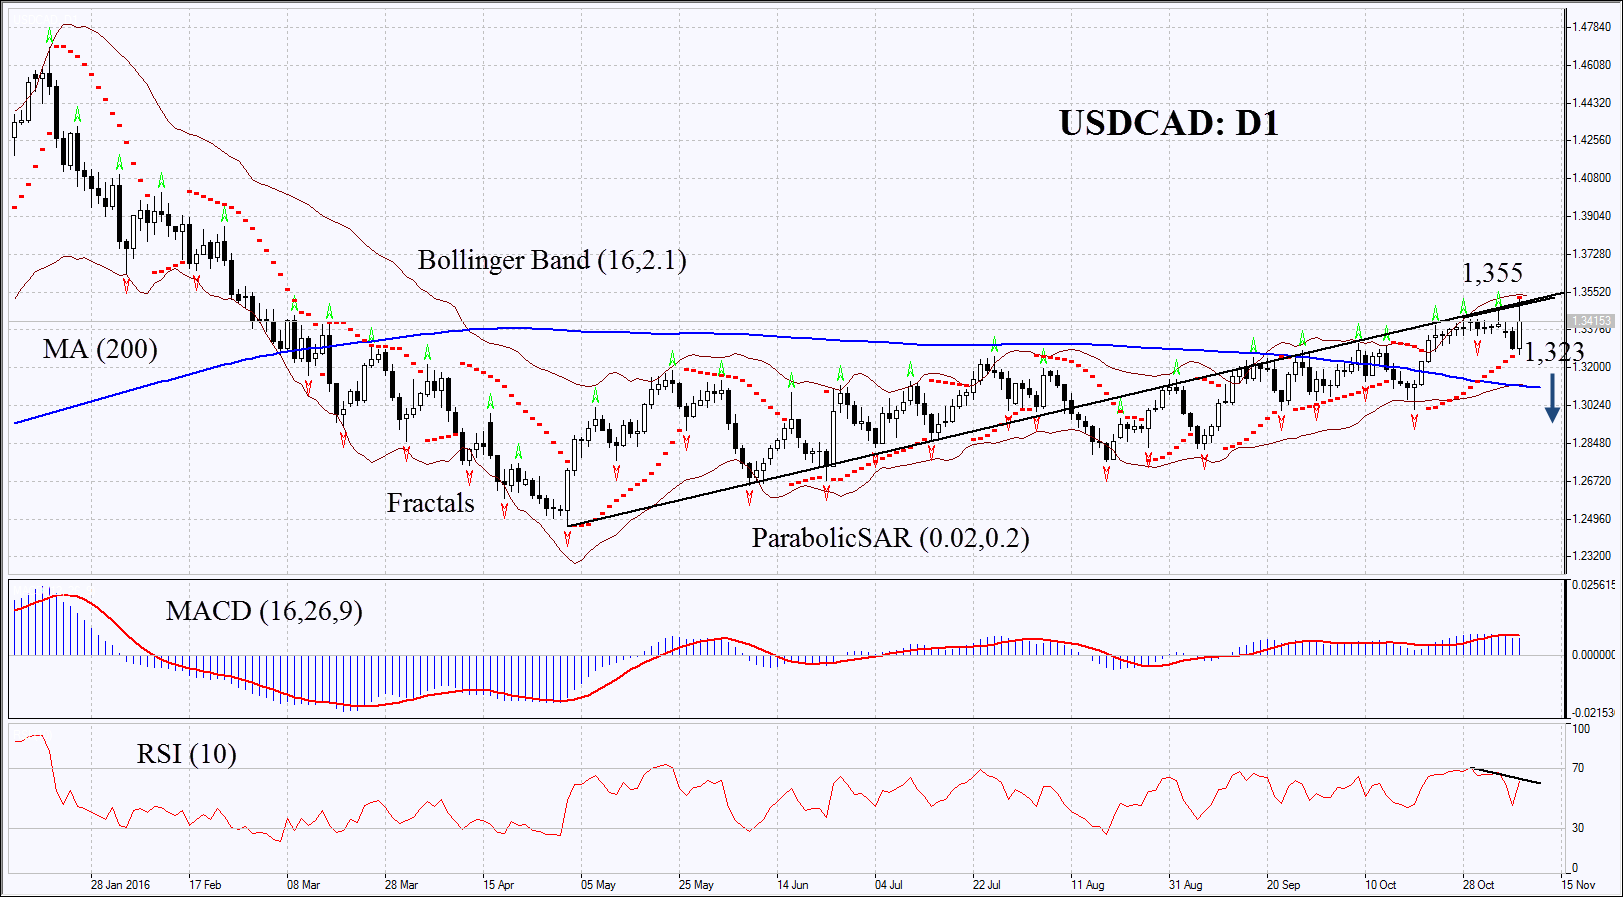
On the daily chart USDCADD1 is within the rising trend. It has approached its resistance but failed to accelerate. Retracement is possible in case new US president leave the base. Correction is possible in case the new president of the United States retains the basic provisions of the NAFTA trading agreement, as well as in case of the increase of oil prices.
- Parabolic gives bearish signals.
- Bollinger bands show normal volatility, they are tilted downwards.
- RSI is above 50. It has formed negative divergence.
- MACD gives bearish signals.
The bearish momentum may develop in case USDCAD falls below Parabolic signal at 1.323. This level may serve the point of entry. The initial risk limit is possible above 8-month high and upper Bollinger band at 1.355. Having opened the pending order we shall move the stop to the next fractal high following the Parabolic and Bollinger signals. Thus, we are changing the probable profit/loss ratio to the breakeven point. The most risk-averse traders may switch to the 4-hour chart after the trade and place there a stop-loss moving it in the direction of the trade. If the price meets the stop-loss level at 1.355 without reaching the order at 1.323, we recommend cancelling the position: the market sustains internal changes which were not taken into account.
Summary of technical analysis:
| Position | Sell |
| Sell stop | below 1.323 |
| Stop loss | above 1.355 |