
The share of the euro in global foreign exchange reserves increased
The IMF reported that the share of the US dollar in foreign exchange reserves decreased to 63,3% in the Q3 of 2016 compared to 63.8% in the Q2. Meanwhile, the share of the euro increased to 20,3% from 20%. Will EURUSD correct up?
Total global foreign exchange reserves increased by 0,36% in the Q3 of the last year - $11,01 billion. The share of the dollar fell to a minimum over 2 years. On Monday, the exchange rate of the euro slightly fell on the background of increased political risks because of the terrorist attack in Turkey. Currency market participants did not reacted to the positive European economic data. The Manufacturing PMI for December rose to the highest since April, 2011 in Eurozone: 54, 9. This happened due to the significant increase of the Manufacturing PMI in Germany – to the highest over 3 years, France – over 5 and a half years and Italy – since June, 2016. Note that on Tuesday, at 16:00 CET the ISM Manufacturing PMI for December will come out in US. It is expected to rise to 53, 7 from 53,2 in November. If the real data are worse than the preliminary forecast, they may weaken the US dollar. On Tuesday, at 14:00 CET the inflation data in Germany will be released. According to the forecasts, it may increase to 1, 4 % year-over-year from 0, 8% in November. In fact, it is difficult to say how investors will react. Perhaps, they will wait for the publication of the December inflation across the Eurozone which is expected on Wednesday and it may be 1%. Let us recall that the ECB’s inflation target is 2%.
On the daily chart EURUSD: D1 is correcting up from the 14-year low, but it keeps trending downwards. Accordingly, to open a sell position, the exchange rate should exceed the resistance level. Further price increase is possible in case of weak economic data in US and positive in Eurozone.
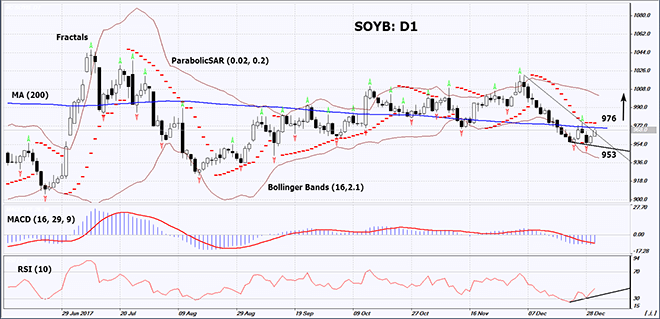
- Parabolic indicator gives a bullish signal.
- Bollinger bands have widened which indicates high volatility.
- RSI is below 50. It has formed positive divergence.
- MACD gives a bullish signal.
The bullish momentum may develop in case the euro surpasses the resistance level of the downward trend and the maximum of Monday at 1,053. The initial stop-loss may be placed below the last three fractal lows, the 14-year low and the Parabolic signal at 1,035. After opening the pending order we shall move the stop to the next fractal low following the Parabolic and Bollinger signals. Thus, we are changing the probable profit/loss ratio to the breakeven point. The most risk-averse traders may switch to the 4-hour chart after the trade and place there a stop-loss moving it in the direction of the trade. If the price meets the stop-loss level at 1,035 without reaching the order at 1,053, we recommend cancelling the position: the market sustains internal changes which were not taken into account.
Summary of technical analysis:
| Position | Buy |
| Buy stop | above 1,053 |
| Stop loss | below 1,035 |