
Dow Jones growth outpaced other US stock indices
In this review we will study the Dow Jones stock index chart. Most stock exchanges will be closed on Monday December 26 due to the Christmas holiday. In recent days investors showed little actilitvy. In the Dow Jones chart the bearish signals have formed. Will it correct down?
No really negative news came out for Dow Jones index. It rose 14.2% since the start of the year. This is more than the advance of S&P 500 (+10.6%) and Nasdaq100 (+7.3%). At the same time, stock indices have merely the same expected P/E ratio for the following 12 months: P/E FY1 = 18.4 for Dow; 18.5 for S&P 500 and 20.6 for Nasdaq100. Hi-tech Nasdaq is historically traded with higher Р/Е. At the same time, for the similar companies and stock indices higher Р/Е may mean that assets are overbought. Dow Jones failed to surpass withiut stopping the psychological level of 20000 points. In theory, this may serve one of the factors for downside correction. US consumer stocks dipped most in the end of the week on the news from CNN that the team of new US President Donuld Trump is considering imposing an import tax of up to 10%.
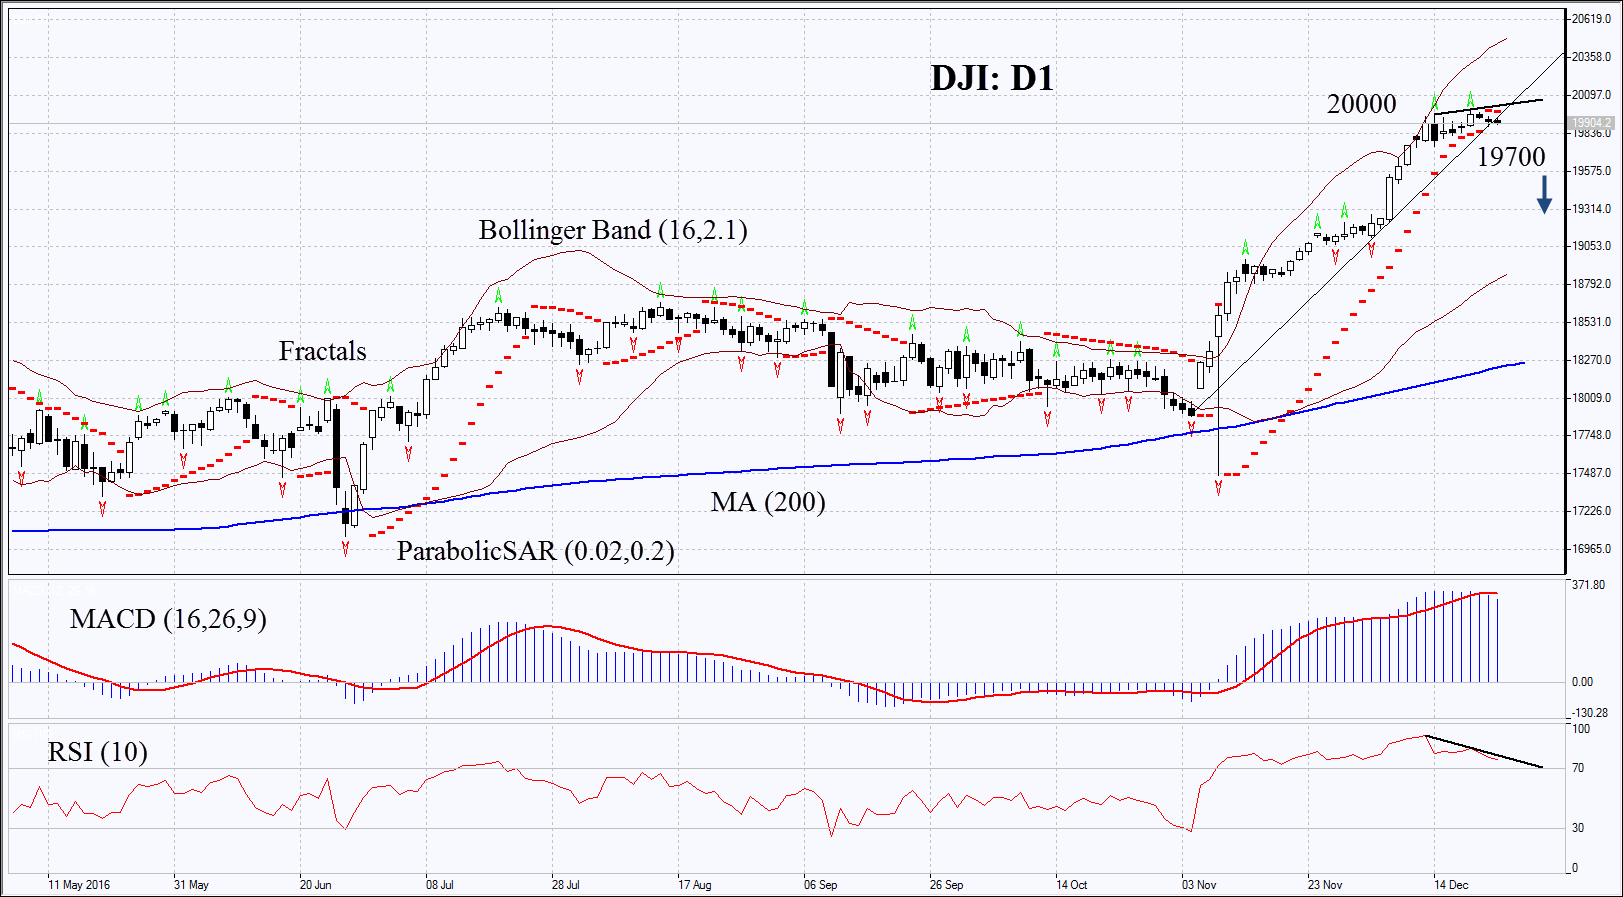
On the daily chart DJI: D1 is within the rising trend. It hit a fresh historical high on December 20, 2016. Nevertheless, pace of growth slowed down and several technical indicators show the possibility of downward correction. Further decline of Dow index is possible in case investors fix profit in the last days of the year as well as in case of negative news and weak economic indicatirs in US.
- Parabolic indicator gives bearish signal.
- Bollinger bands have widened a lot which means higher volatility.
- RSI is in the overbought zone having formed negative divergence.
- MACD gives bearish signals.
The bearish momentum may develop in case DJI falls below the Parabolicsignal at 19700. This level may serve the point of entry. The initial stop-loss may be placed above the historical high at 20000. Having opened the pending order we shall move the stop to the next fractal high following the Parabolic and Bollinger signals. Thus, we are changing the probable profit/loss ratio to the breakeven point. The most risk-averse traders may switch to the 4-hour chart after the trade and place there a stop-loss moving it in the direction of the trade. If the price meets the stop-loss level at above 20000 without reaching the order at 19700, we recommend cancelling the position: the market sustains internal changes which were not taken into account.
Summary of technical analysis:
| Position | Sell |
| Sell stop | below 19700 |
| Stop loss | above 20000 |