
Donald Trump criticized German carmakers
US President Donald Trump criticized German carmakers for building plants not in US but in Mexico while are going to sell the cars in US. Donald Trump promised to introduce for these companies a 35% import tax. This may lead to losses of German companies. Will German stock index DAX decline?
Prohibitive tariff on sales in US of cars assembled in Mexico may harm German BMW, Daimler and Volkswagen. Their total investment projects in Mexico amount to $4.5bn. Moreover, Volkswagen wiil pay out the penalty of $4.3bn to regulate the “diesel scandal” The share of these three carmakers in DAX index capitalization is about 20%. Another negative factor for German stock market may become the soaring inflation. It reached 1.7% year over year last December which is the highest since July 2013. In EU December inflation could have reached 1.1% which would be the record high since August 2013. The final German inflation data will come out in EU on January 18, 2017. In theory, the ECB may react on them with comments on possible QE tapering in Europe in its next meeting on January 19, 2016.
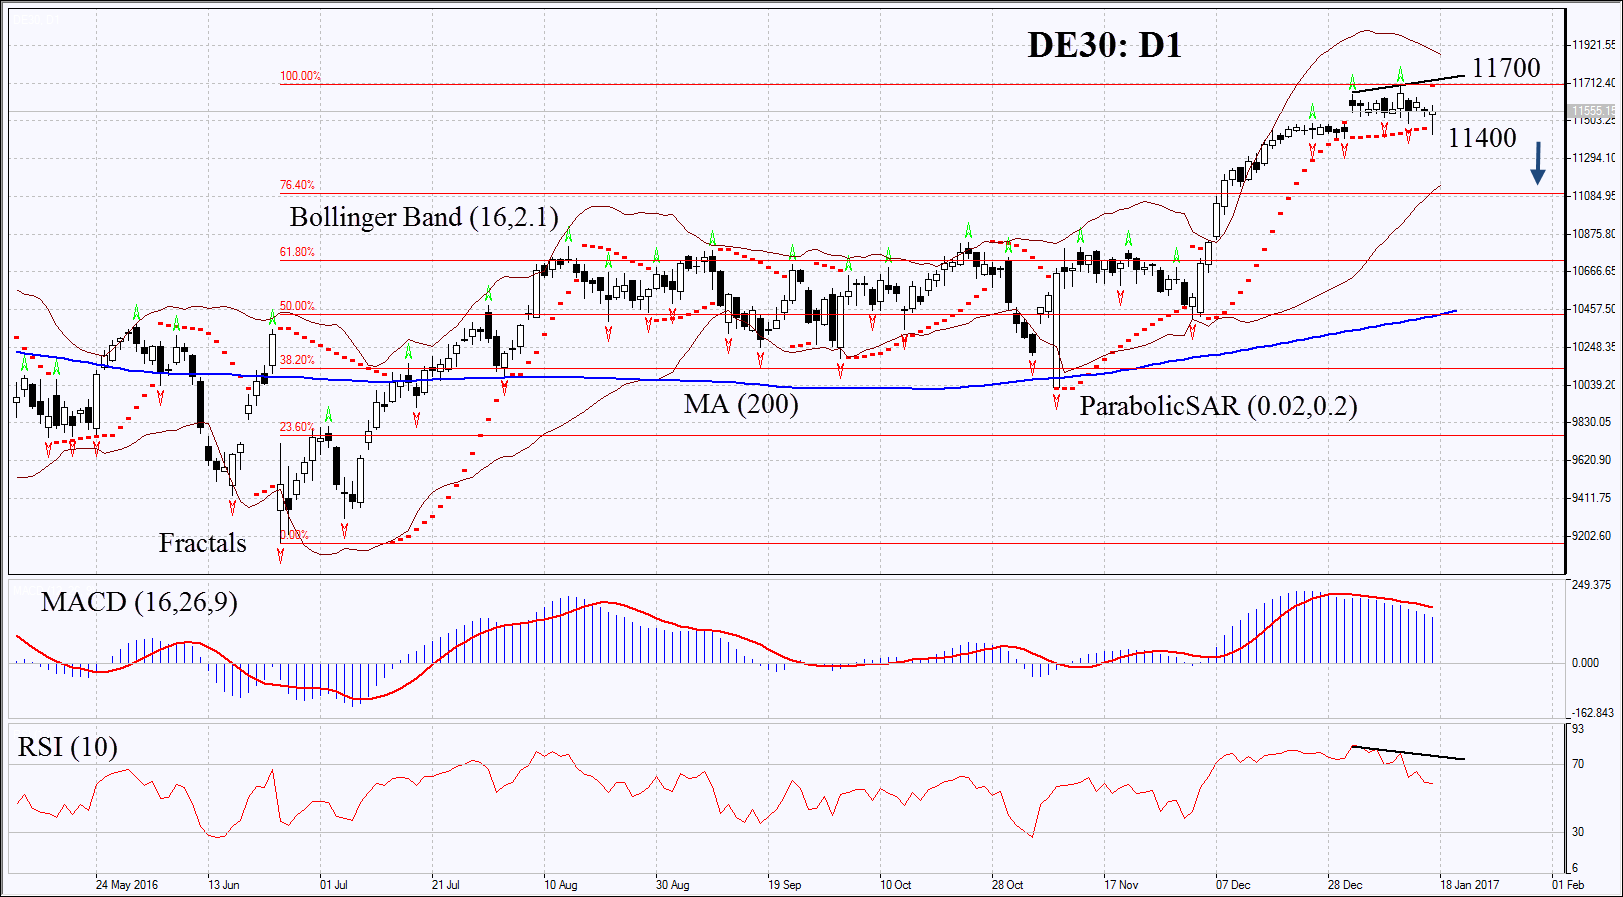
On the daily chart DE30: D1 stays within the rising trend but the pace of its growth have slowed down and several technical indicators have formed signals to sell. Its further decline is possible in case negative news come out from ECB and in case of weak economic indicators and corporate reports in Germany.
- The Parabolic gives bearish signal.
- The Bollinger bands have contracted which means lower volatility.
- The RSI is above 50 having formed negative divergence.
- The MACD is giving bearish signals.
The bearish momentum may develop in case DE30 falls below the three last fractal lows at 11400. This level may serve the point of entry. The initial stop-loss may be placed above the 1-1/2-year high, the last fractal high and the Parabolic signal at 11700. Having opened the pending order we shall move the stop to the next fractal high following the Parabolic and Bollinger signals. Thus, we are changing the probable profit/loss ratio to the breakeven point. The most risk-averse traders may switch to the 4-hour chart after the trade and place there a stop-loss moving it in the direction of the trade. If the price meets the stop-loss level at 11700 without reaching the order at 11400, we recommend cancelling the position: the market sustains internal changes which were not taken into account.
Summary of technical analysis:
| Position | Sell |
| Sell stop | below 11400 |
| Stop loss | above 11700 |