
Decline in cultivated wheat and bad weather pushed wheat prices up
VUSDA revised down the weekly rating of winter wheat sowings of «good and excellent» quality to 58% from 59% in previous week. This happened on draught in the Great Plains region. Will global wheat prices continue advancing?
On Tuesday they rose for 4th trading day in a row. Such a trend started last week after the Informa Economics agency lowered the forecast of winter wheat cultivation in US in 2017 to 33.76mln acres from 35.42mln acres in previous year. Now the planting is over on 97% of territories and official data are to come out soon. They may affect the prices. Food Corporation of India (FCI) expects wheat crops in India in 2015/16 to total 88mln tonnes. Previously the officials released their crops forecast of 93.5mln tonnes. FCI also expects wheat stockpiles in central storage facility to fall to 18.8mln tonnes from 29.9mln tonnes in previous year. Crops fell on worsened weather conditions. The neighbouring Bangladesh announced the acquisition of 200 thousand tonnes of Russian wheat for $245 a tonne to replenish national stockpiles. Russia cut wheat export since July 1 to November 16 this year to 11.7mln tonnes. This is 4.6% below the last year level for the same period.
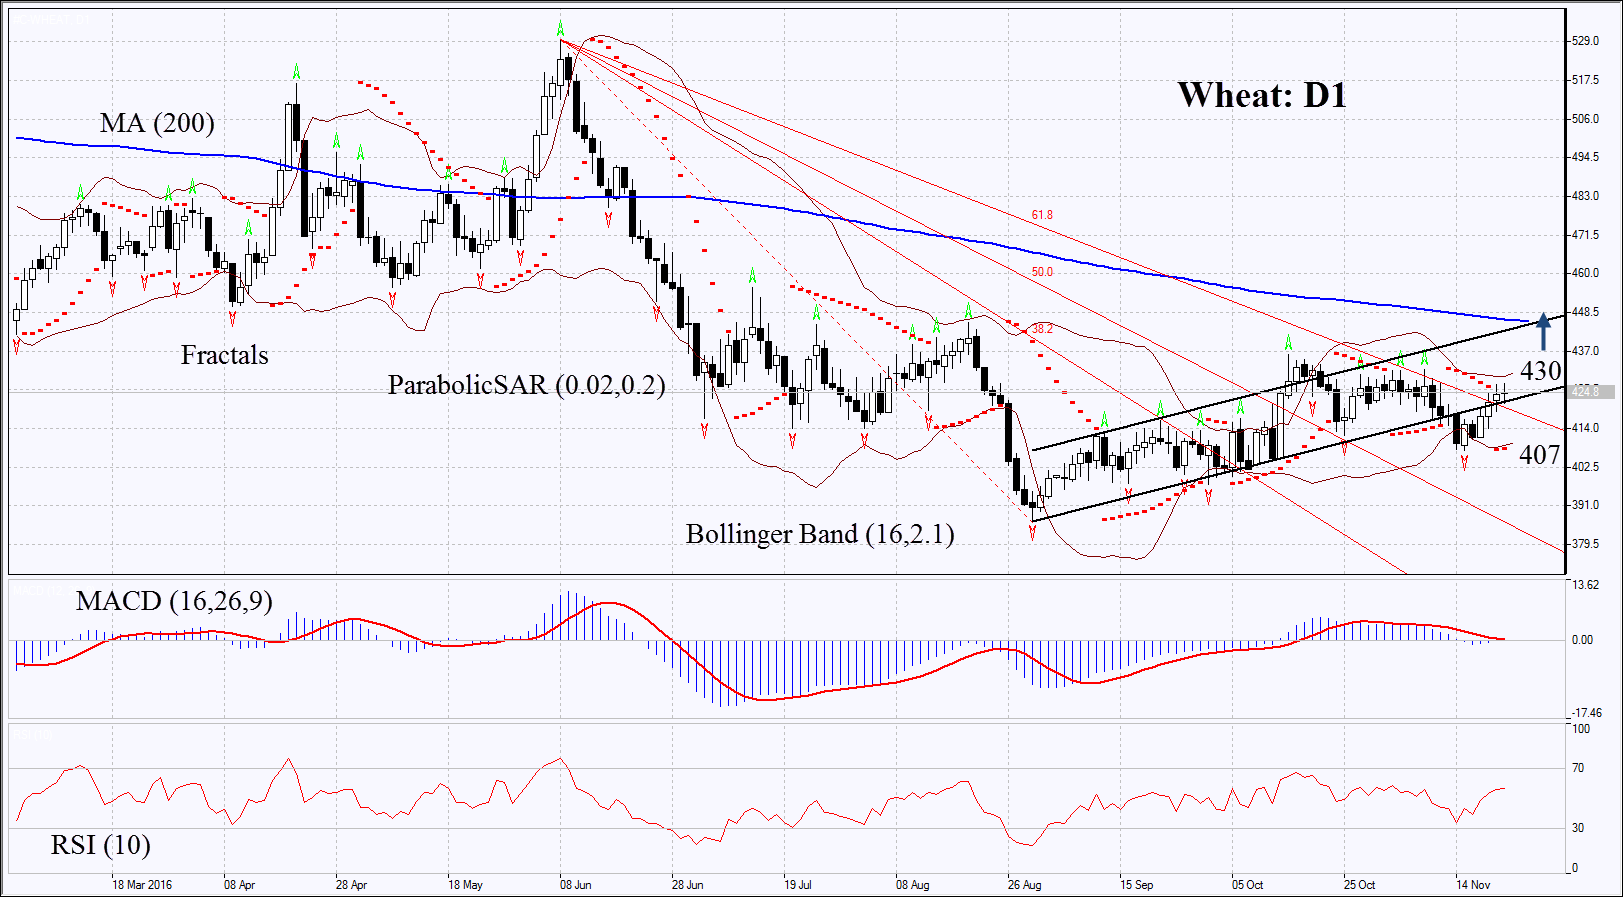
On the daily chart Wheat: D1 returned to the rising channel and overcame the Gann resistance line. Further price increase is possible in case of worse weather conditions and official reduction of wheat cultivation areas in US.
- Parabolic gives bullish signal.
- Bollinger bands have widened which means extremely low volatility.
- RSI is above 50, no divergence.
- MACD gives bullish signal. Its low amplitude may mean low volatility.
The bullish momentum may develop in case wheat surpasses the upper Bollinger band and the Parabolic signal at 430. This level may serve the point of entry. The initial stop-loss may be placed below the last fractal low, the lower Bollinger band and the Parabolic signal at 407. Having opened the pending order we shall move the stop to the next fractal low following the Parabolic and Bollinger signals. Thus, we are changing the probable profit/loss ratio to the breakeven point. The most risk-averse traders may switch to the 4-hour chart after the trade and place there a stop-loss moving it in the direction of the trade. If the price meets the stop-loss level at 407 without reaching the order at 430, we recommend cancelling the position: the market sustains internal changes which were not taken into account.
Summary of technical analysis:
| Position | Buy |
| Buy stop | above 430 |
| Stop loss | below 407 |