
Soy oil meal falls behind soy
Soy oil meal prices visibly fell behind soy prices. On Monday soybeans advanced for 7-th straight trading day. Their price reached the high in 4-1/2 months. Will SOYBM continue advancing?
Soy prices climb on higher global demand and exports from US. It has been above 2mln tonnes a week in recent three weeks. USDA expects soy exports to reach 24mln tonnes this year which is 20% above the last year level. Additional positive is rainy weather in Brazil which may harm soy crops in this season. Previously Brazil’s exporters association Anec forecasted Brazilian soy shipments to the global markets to reach 51-52mln tonnes in 2016 and 60mln tonnes in 2017. Soy oil meal is used to produce combined feed for livestock animals and poultry. As a rule, it is soy oil meal waste. Soy oil meal normally correlates with soybeans prices.
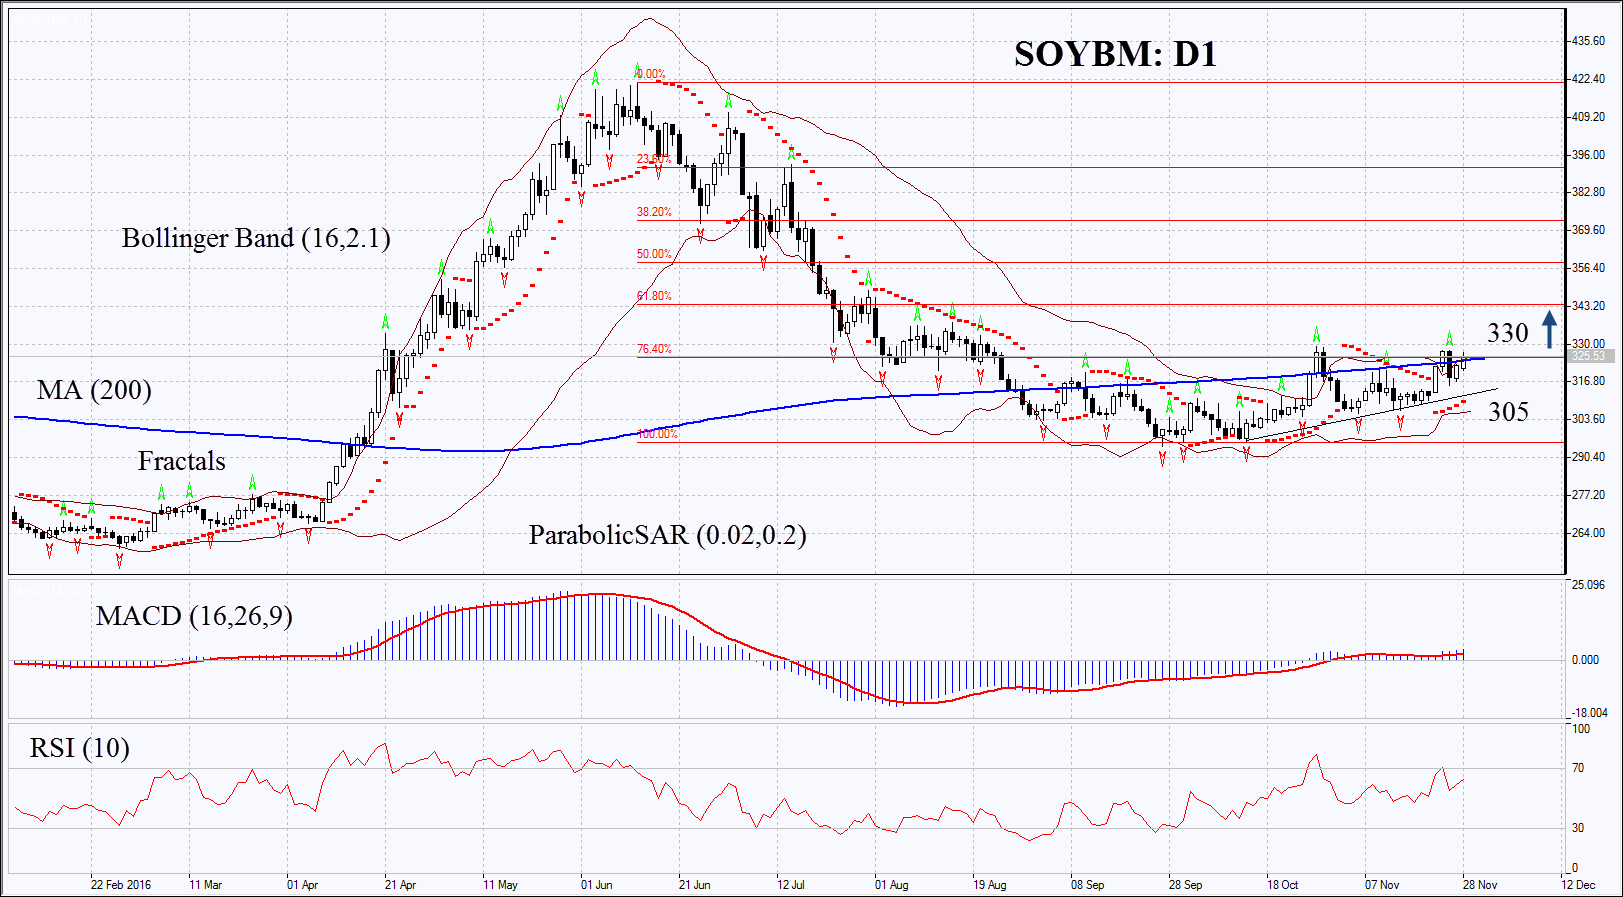
On the daily chart SOYBM: D1 is in rising trend struggling for surpassing for the 2nd time its 200-day moving average. Further price increase is possible in case of lower crops forecasts in Latin America and in case high demand persists.
- Parabolic gives bullish signals.
- Bollinger bands have narrowed a lot which means lower volatility.
- RSI is above 50, but is far from the overbought zone, no divergence.
- MACD gives bullish signal.
The bullish momentum may develop in case SOYBM surpasses the three last fractal highs, the 200-day moving average, 1st Fibonacci level and upper Bollinger band at 330. This level may serve the point of entry. The initial stop-loss may be placed below the support of the uptrend, two last fractal lows, Parabolic signal and the lower Bollinger band at 305. Having opened the pending order we shall move the stop to the next fractal low following the Parabolic and Bollinger signals. Thus, we are changing the probable profit/loss ratio to the breakeven point. The most risk-averse traders may switch to the 4-hour chart after the trade and place there a stop-loss moving it in the direction of the trade. If the price meets the stop-loss level at 305 without reaching the order at 330, we recommend cancelling the position: the market sustains internal changes which were not taken into account.
Summary of technical analysis:
| Position | Buy |
| Buy stop | above 330 |
| Stop loss | below 305 |