
Strong US export performance and ethanol production support corn prices
Corn prices advance on strong US export performance and ethanol production. Will the price of corn continue rising?
China’s Ministry of Agriculture downgraded its imports forecast for the 2016-2017 crop year that ends in September by 200,000 tonnes from previous estimate to as low as 800,000 tonnes. However the US Department of Agriculture expects imports at 3 million tonnes. Lower import demand will be bearish for corn prices as China tries to draw down its state corn reserve after the government abandoned its longstanding price support program last year. On the other hand, strong US export performance and demand for corn for ethanol production provides support for corn prices: US ethanol production last week was at a still-strong 1.055m barrels a day while down 6000 barrels a day from the previous week's record. This translates into annualised use of corn for ethanol at a record 5.576bn bushels compares with a current USDA estimate for the full 2016-17 of 5.325bn bushels.
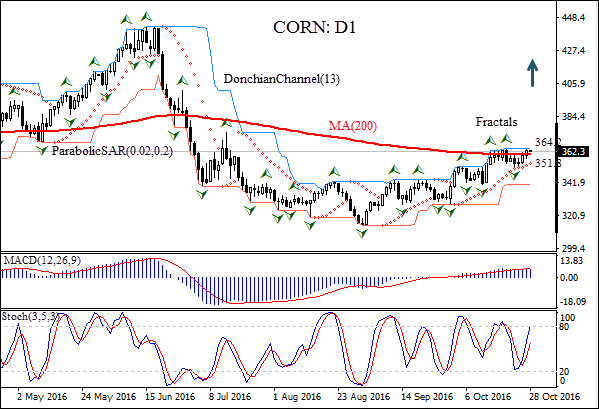
On the daily timeframe CORN:D1 has been rising after hitting multi-year low at the end of August. The price is rising above the 50-day and 200-day moving averages MA(50) and MA(200) after the MA (50) crossed above the MA(200) from below, forming a golden cross pattern.
- The Donchian channel indicates an uptrend: it is tilted up.
- The Parabolic indicator gives a buy signal.
- The MACD indicator is above the signal line and the gap is rising, which is a bullish signal.
- The stochastic oscillator has is rising but has not yet crossed into the overbought zone.
We believe breaching above the upper Donchian boundary at 376.7 will signify continuation of the bullish momentum. It can be used as an entry point and a pending order to buy can be placed above that level. The stop loss can be placed below the last fractal low at 368.1. After placing the pending order the stop loss is to be moved every day following Parabolic signals. Thus, we are changing the probable profit/loss ratio to the breakeven point. If the price meets the stop loss level (368.1) without reaching the order (376.7), we recommend cancelling the position: the market sustains internal changes which were not taken into account.
Summary of technical analysis:
| Position | Buy |
| Buy stop | Above 376.7 |
| Stop loss | Below 368.1 |