
Preparing for important data
The Reserve Bank of Australia met on Tuesday. As expected, it left the base rate at +1.5%. Moreover, the positive trade balance data for current account balance came out. WIll Australian dollar advance?
Current account deficit was A$11.4 bn in Q3 2016 in Australia which is 28% below the level of Q2. The reading was far above expectations. The Q3 2016 GDP will come out on Wednesday morning, December 7. The increase of the benchmark is expected to be 2.5% YoY which is the lowest in 4 quarters. If the real reading comes out better, like in case with current accout deficit, it may support Australian dollar. In theory, higher index of commodity prices by the Reserve Bank of Australia supports the stance. It advanced 10% this November as non-ferrous metal prices edged up. Fed funds futures price in just 14$ chance of the Fed rate hike in the middle of next year. This is the positive factor for Australian dollar. The next significant data are to come out in Australia on Thursday on December 8 – trade balance for October.
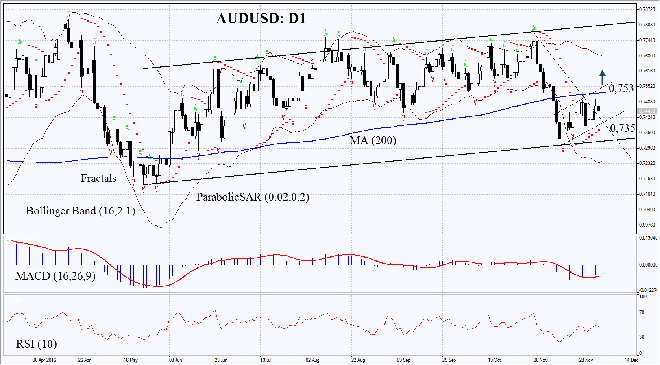
On the daily chart AUZDUSD: D1 has bounced up from support of the rising channel and started correcting upwards. Further price increase is possible in case of strong economic data in Australia and weaker US dollar.
- Parabolic gives bullish signal.
- Bollinger bands have widened a lot which means higher volatility.
- RSI is is below 50. No divergence.
- MACD gives bullish signal.
he bullish momentum may develop in case Australian dollar surpasses the last fractal high and the 200-day moving average at 0.753. This level may serve the point of entry. The initial stop-loss may be placed below the two last fractal lows, the support of the rising channel and the Parabolic signal at 0.735. Having opened the pending order, we shall more the stop to the next fractal low following the Bollinger and Parabolic signals. Thus, we are changing the probable profit/loss ratio to the breakeven point. The most risk-averse traders may switch to the 4-hour chart after the trade and place there a stop-loss moving it in the direction of the trade. If the price meets the stop-loss level at 0.735 without reaching the order at 0.753, we recommend cancelling the position: the market sustains internal changes which were not taken into account.
Summary of technical analysis:
| Position | Buy |
| Buy stop | above 0.753 |
| Stop loss | below 0.735 |