
Anticipating important data later this week
Australian stock index AU200 may correct down amid sharp strengthening of Australian dollar. High rate of national currency may weigh on financial statement of exporters. Will AU200 continue falling?
Iron ore, coal and natural gas are major export commodities of Australia. Global steal prices have soared more than 50% since October 2016. Now they are slightly correcting down which may also push down the stocks of Australian mining companies. Coal prices are already showing similar dynamics but in their chart the downward correction started about two months ago. The Australian labour market data for December will come out on Thursday, January 19, 2017. The unemployment is expected to remain at 5.7% but the number of job openings may fall. Theoretically, this may have negative effect on Australian index. Chinese GDP for Q4 2016 will come out on Friday and may weigh on dynamics of AU200 index as China is the major trade partner of Australia.
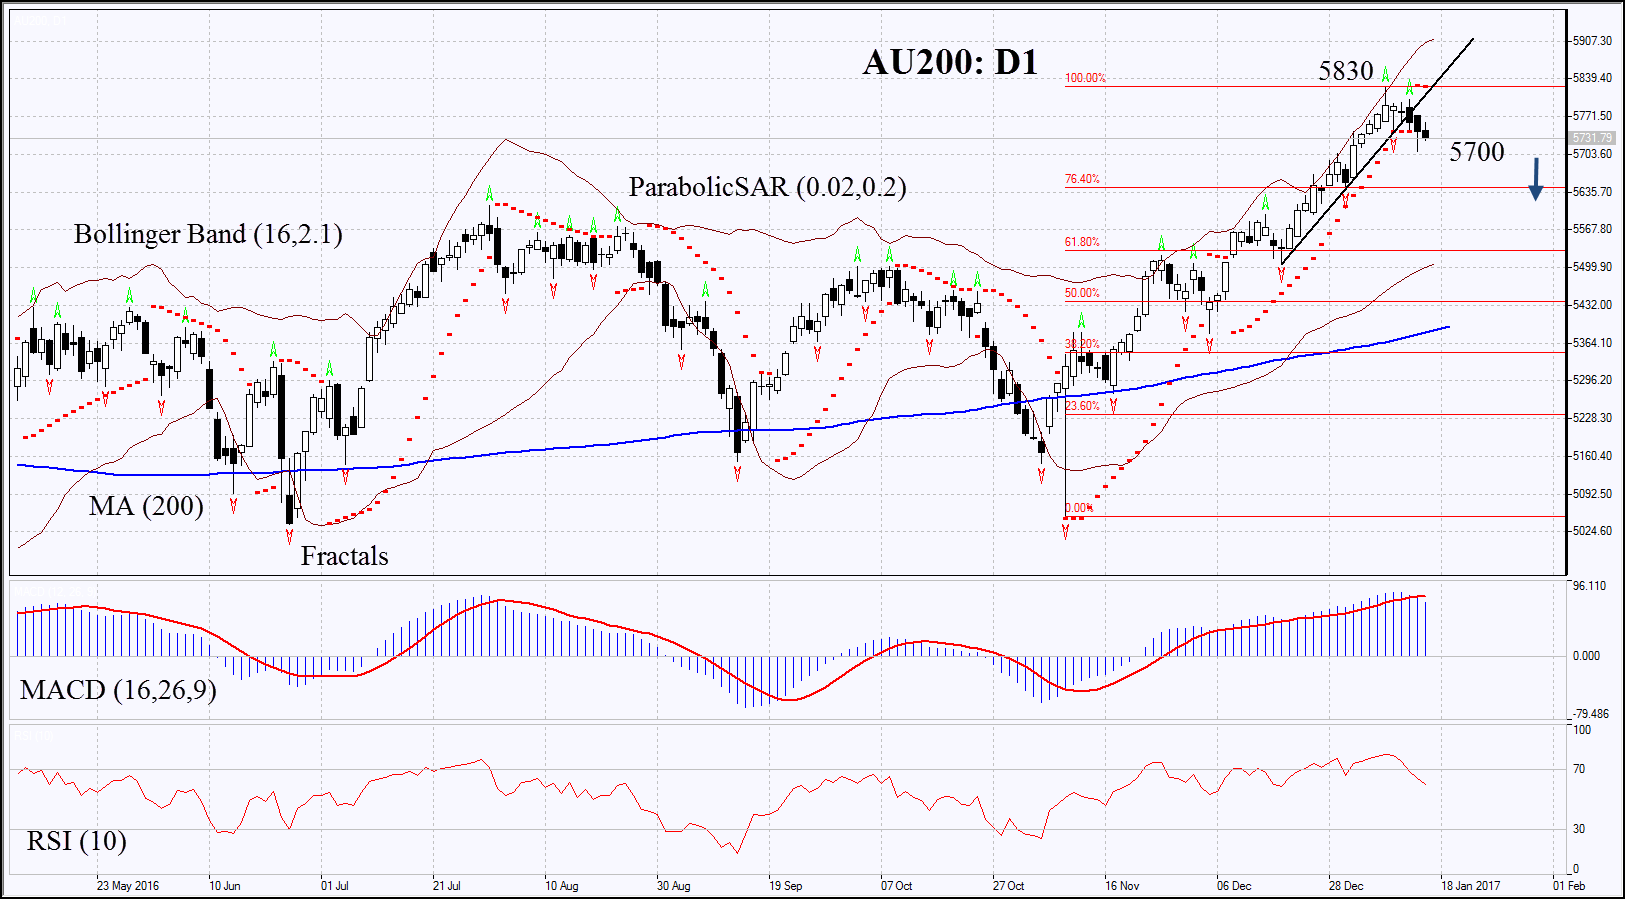
On the daily chart AU200: D1 has broken below the support of the rising trend and is correcting down. Its further decline is possible in case negative news and economic data come out in Australia and in case of lower global commodity prices.
- The Parabolic gives bearish signal.
- The Bollinger bands have widened a lot which means higher volatility.
- RSI is above 50, no divergence.
- MACD is giving bearish signals.
The bearish momentum may develop in case AU200 falls below the last low of 5700. This level may serve the point of entry. The initial stop-loss may be placed above the 20-month high, the two last fractal highs and the Parabolic signal at 5830. Having opened the pending order we shall move the stop to the next fractal high following the Parabolic and Bollinger signals. Thus, we are changing the probable profit/loss ratio to the breakeven point. The most risk-averse traders may switch to the 4-hour chart after the trade and place there a stop-loss moving it in the direction of the trade. If the price meets the stop-loss level at 5830 without reaching the order at 5700, we recommend cancelling the position: the market sustains internal changes which were not taken into account.
Summary of technical analysis:
| Position | Sell |
| Sell stop | below 5700 |
| Stop loss | above 5830 |