
Improved global growth will lift Australia stock index
TAustralia’s AU 200 stock market index rose even though the GDP fell in third quarter, the first contraction since 2011. Will AU200 index continue rising?
The Reserve Bank of Australia left the interest rate unchanged at 1.5% at its December 6 policy meeting. The central bank stated the economy is transitioning following the boom in mining investment. It forecast Australian economy growth will slow down at year end before accelerating again. Data next day indicated the gross domestic product fell 0.5% in the third quarter from the second quarter, the first contraction in 5 years. The central bank highlighted favorable developments like rising commodity prices, which supported a rise in Australia’s terms of trade, and steadied economic conditions in China, Australia’s biggest trade partner, supported by growth in infrastructure and property construction. Falling business investment was the main detractor from growth, and Treasurer Scott Morrison called on lawmakers to support fiscal stimulus measures including tax cuts for small businesses. A trade report on Thursday showed China’s imports grew at 6.7% on year in November, the fastest pace in more than two years, driven by sharp rise in demand for commodities from coal to iron ore, while exports also rose unexpectedly 0.1% from a year earlier due to a pick-up in both domestic and global demand. With Australia’s unemployment rate falling and declining exchange rate supporting export sectors Australia is positioned to benefit from improving global growth led by accelerating US economy which is expected to receive additional boost from expansionary fiscal measures such as tax cuts and infrastructure spending President Trump has proclaimed will enact.
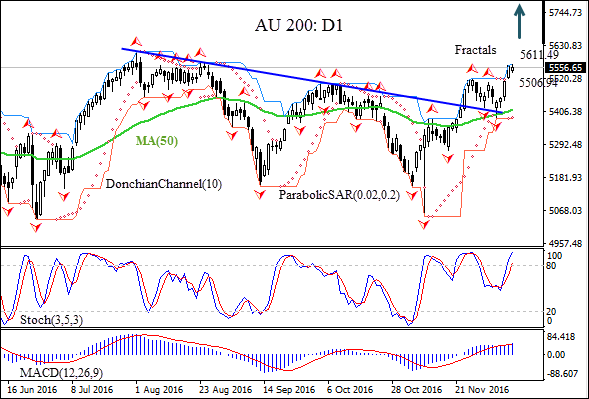
On the daily chart the AU200 has breached above the resistance line of the downtrend in mid-November. The price is rising after bouncing off the rising 50-day Moving Average MA(50).
- The Parabolic indicator has formed a buy signal.
- TheDonchian channel is tilting higher, signaling start of uptrend.
- The Stochastic oscillator has breached into oversold zone.
- The MACD indicator gives a bullish signal.
We expect the bullish momentum will continue after the price breaches above the upper Donchian bound and 15 month high at 5611.49. This level can be used as an entry point for a pending order to buy. The stop loss can be placed below the last fractal high at 5506.94. After placing the pending order, the stop loss is to be moved to the next fractal low, following Parabolic signals. By doing so, we are changing the probable profit/loss ratio to the breakeven point. If the price meets the stop loss level (5506.94) without reaching the order (5611.49), we recommend canceling the position: the market sustains internal changes which were not taken into account.
Summary of technical analysis:
| Position | Buy |
| Buy stop | Above 5611.49 |
| Stop loss | Below 5506.94 |