
Japanese candles are the most popular types of price chart among traders, which reflect the changes of the stock market quotations of shares, currency pairs, commodities, etc.They are considered to be a kind of technical indicators, which reflect the dynamics of changes of market price within the interval of building a candle (time-frame).
The popularity of this type of chart is due to the fact that it reflects simultaneously the long-term trend and the general price behavior of the time interval of building a candle (time-frame).
Building
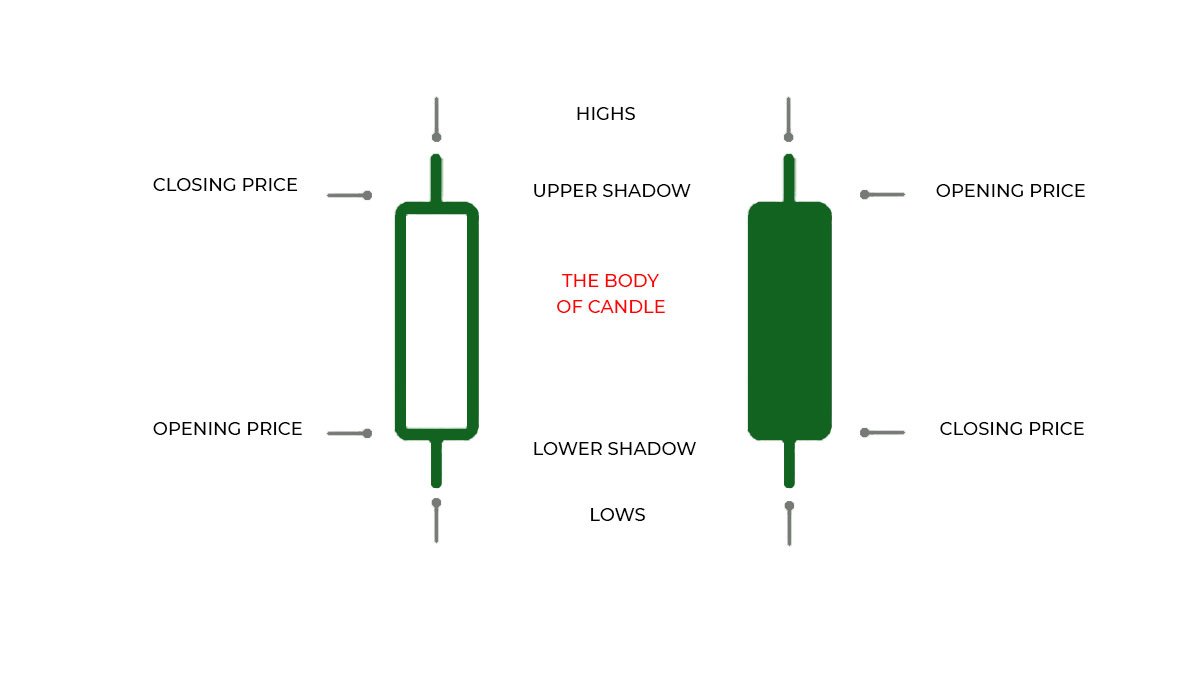
In order to show the price of a financial instrument with the help of candles, one will need the opening price, closing price, highs and lows for each time frame. The candle consists of a dark or light body, an upper and lower shadow. Accordingly, the borders of a body reflect the opening and closing prices and the upper and lower borders of shadows reflect the highs and lows for the corresponding period of time.
There are many patterns representing configurations from several candles. The simplest case is the variations of a candle:
- Light candle -shows the prices moving up and signalizes the strong activity of buyers. The longer the light candle, the higher the closing price and the stronger the upward movement.
- Dark candle – shows the prices moving down and signalizes the activity of sellers. The higher the dark candle, the lower the closing price and the stronger the downward movement.
- Upper and lower shadows – present the highs and lows of one time frame. Candles with short shadows indicate that most of the trade, within a given period of time, was concentrated mainly on the opening and closing prices. The long shadows indicate that during the session the price was moving far away from the opening and closing prices. The small body of a candle (price interval between the opening position and the closing position), as a rule, shows the high volatility within a time frame or the change of a trend.
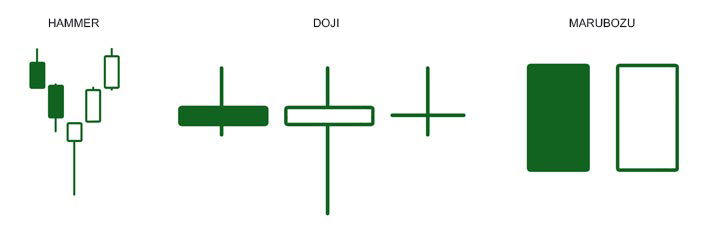
- Hammer – the small body of a candle and the long lower shadow characterize the inability of the market to keep on selling, in other words, the price has probably touched bottom and it is expected to rise again. Hammer is a “bullish reversal” formed in a downtrend.
- Doji – a very small body of a candle. The opening and closing prices of this candle are practically the same. Doji gets its true significance when combined with other types of candles. The appearance of several successive Doji candles on the chart indicates that the market fluctuates greatly. Moreover, the inceptive movement can be very strong.
- Marubozu – the candle has only a body (there are no shadows). If the body is dark, the Bears dominate by maintaining the downward trend and if the body is light, the Bulls dominate by maintaining the upward trend.
Historical background
Candlestick charts are believed to be invented in the 18th century by a trader named Homma Munehisa, who was analyzing the futures market (he was mainly interested in rice) on the basis of the prices with highs and lows within a certain period of time, and also the prices of the beginning and ending of a certain period. While working on the largest stock exchange in Japan, he was studying the psychology of traders and the impact of various factors on the formation of prices.
The West discovered candlestick charts only in the beginning of 1990s. Steve Nison, a technical analyst, was introduced with candlestick charts by a Japanese woman, who was a broker. After getting acquainted with the candles he wrote a book “Japanese candles: graphical analysis of financial markets”. The book was a great success and gained much popularity among traders.