EUR/USD remains slightly above 1.3500
EUR/USD moved in a consolidative mode on Thursday, remaining slightly above the key 1.3500 (S1) barrier. I still expect the rate to challenge that psychological zone. The RSI lies within its oversold field, testing its 30 level, while the MACD shows signs of bottoming and seems ready to move above its signal line. Taking this into account, it’s possible that EUR/USD could consolidate or even bounce slightly before the bears show their teeth again. On the daily chart, the 50-day moving average is getting even closer to the 200-day moving average. A bearish cross in the near future would be an additional negative sign. My opinion is that we should wait to see if the sellers are strong enough to overcome the 1.3500-1.3475 zone before expecting larger bearish extensions in the future.

• Support: 1.3500 (S1), 1.3475 (S2), 1.3400 (S3)
• Resistance: 1.3580 (R1), 1.3650 (R2), 1.3700 (R3)
USD/JPY touches 101.10 and rebounds
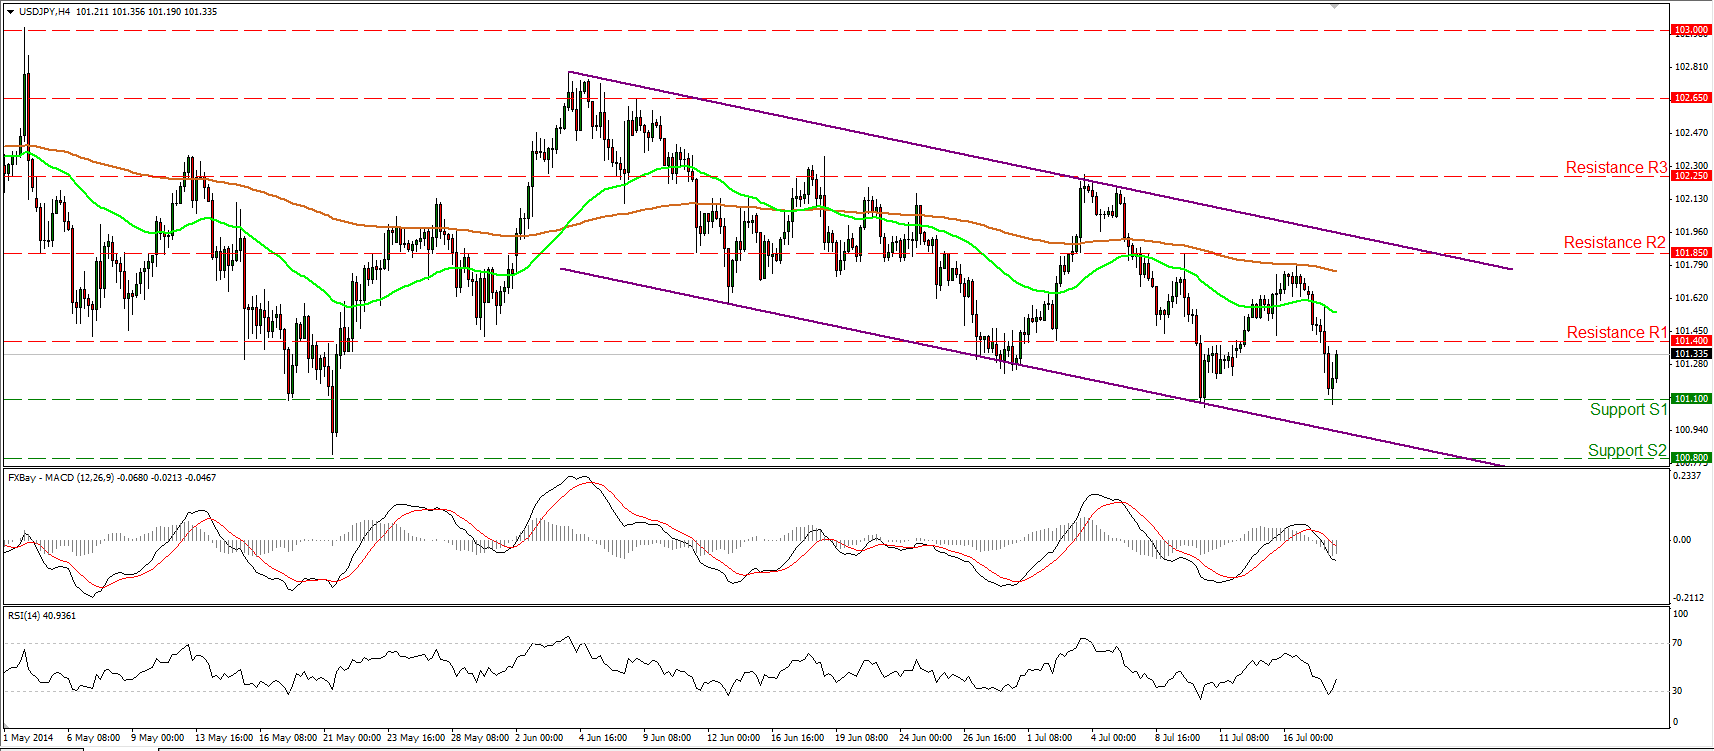
USD/JPY tumbled yesterday, breaking below the 101.40 (support turned into resistance), and reached our next barrier at 101.10 (S1). Nevertheless, the rate triggered some buy orders below that barrier, rebounded and at the time of writing, is heading back towards the 101.40 (R1) barrier to challenge it as a resistance this time. A decisive violation of that bar is likely to see scope for another test near the 101.80/85 (R2) zone. The pair is trading within the purple downside channel though and as a result, I would consider the overall short-term path to remain to the downside and any advances within the channel as corrective waves.
• Support: 101.10 (S1), 100.80 (S2), 100.40 (S3)
• Resistance: 101.40 (R1), 101.85 (R2), 102.25 (R3)
IS EUR/GBP ready to retrace?
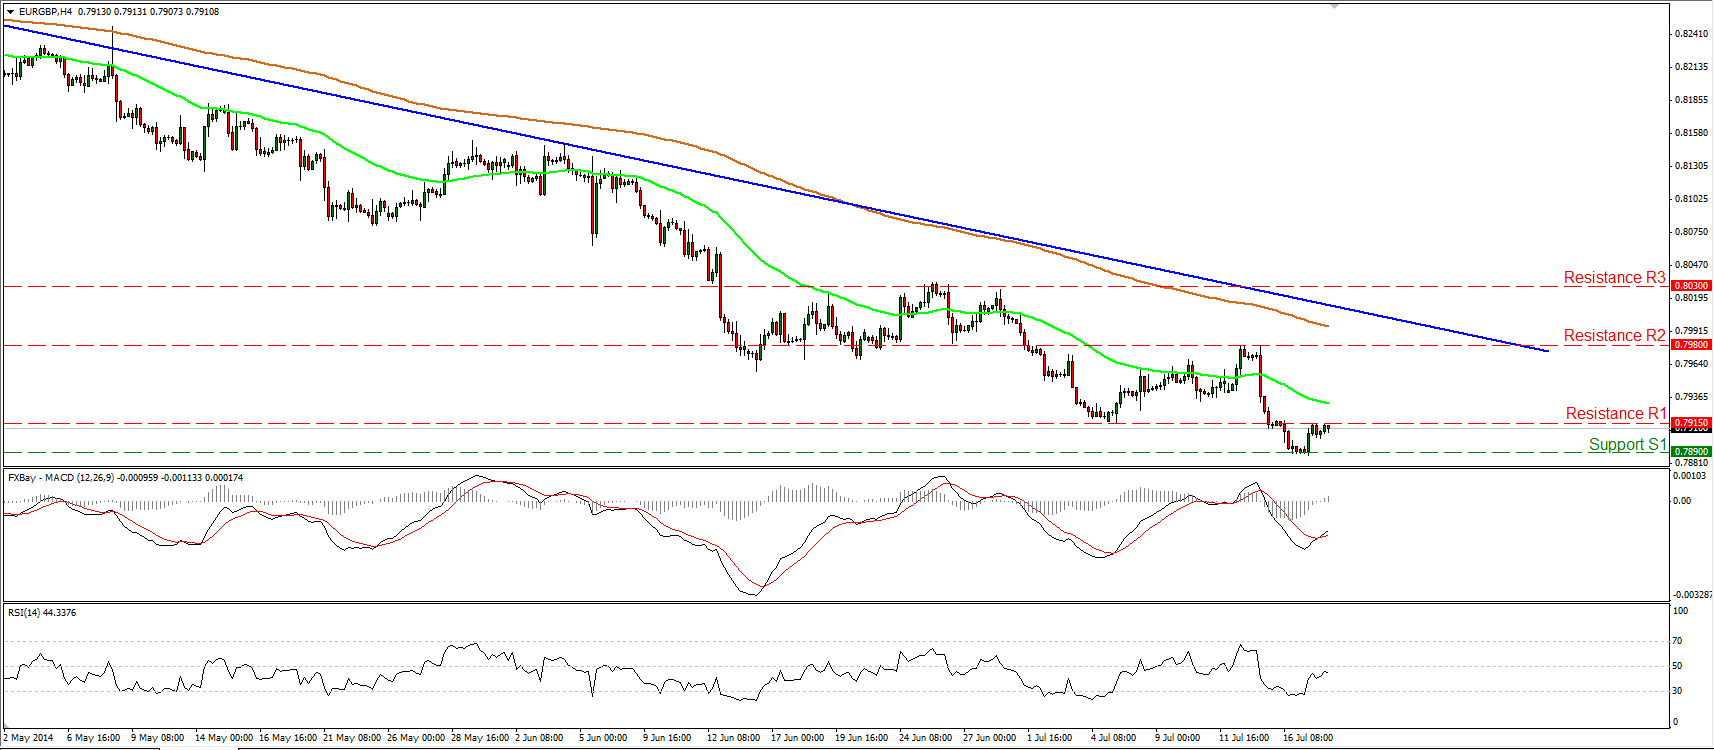
EUR/GBP moved marginally higher after finding support at 0.7890 (S1) and is currently testing the 0.7915 (R1) as a resistance. A clear violation above that level could signal the continuation of the rebound and trigger extensions towards the 0.7980 (R2) zone or near the blue downtrend line. Moreover, on the daily chart I can see positive divergence between our daily momentum studies and the price action, magnifying the case for an upside corrective wave in the near future. Nonetheless, as long as the pair is trading below the blue downtrend line drawn from back the 11th of April, I see a negative overall outlook and I would take a possible continuation of the rebound as a retracement.
• Support: 0.7890 (S1), 0.7830 (S2), 0.7760 (S3)
• Resistance: 0.7915 (R1), 0.7980 (R2), 0.8030 (R3)
Gold surges and touches 1325
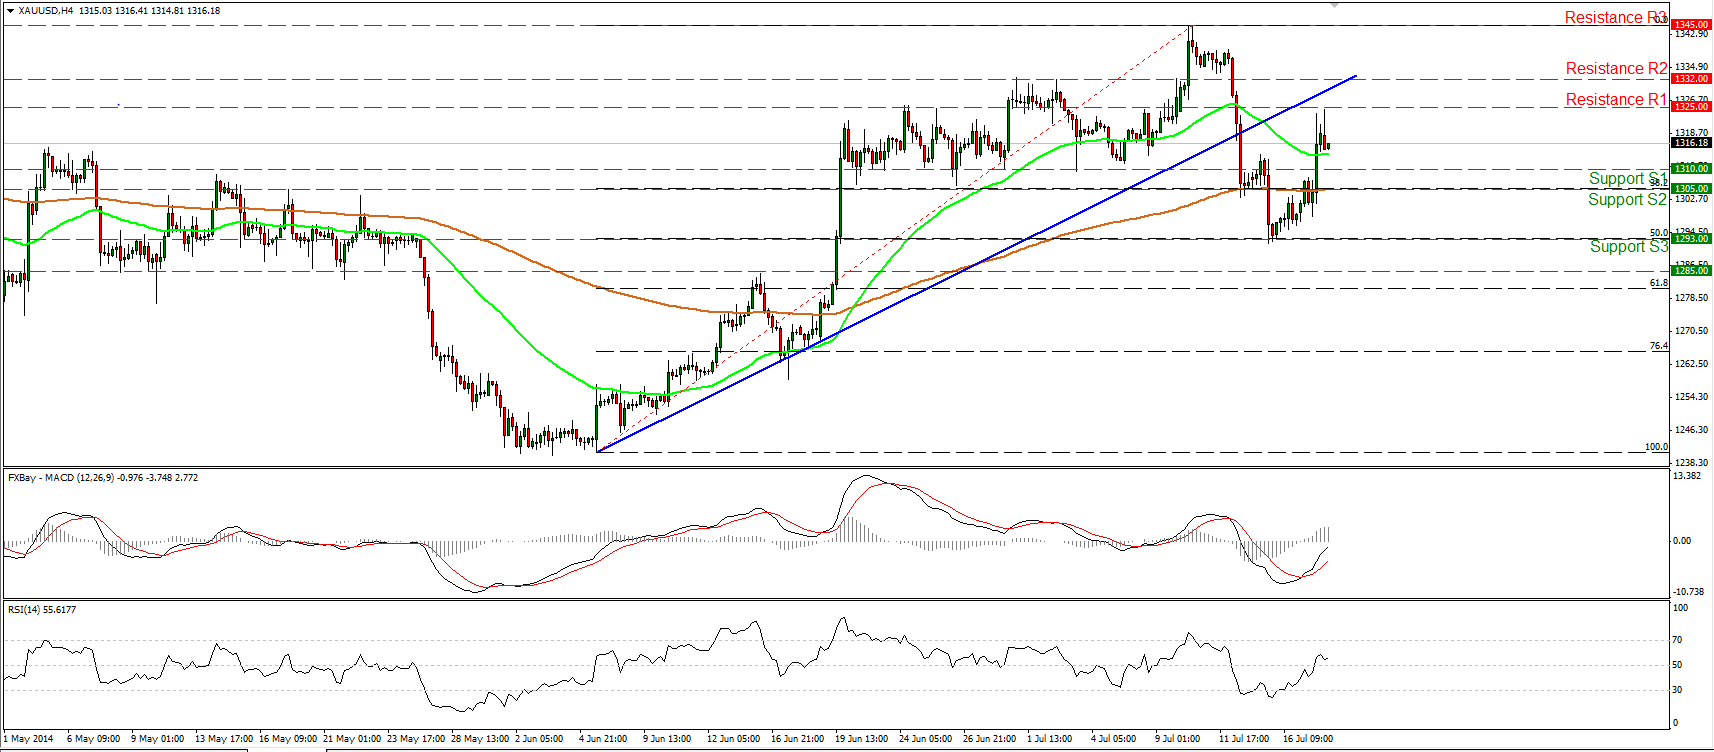
Gold emerged above the resistance zone (turned into support) of 1305/10 and reached the next area of 1325 (R1). This could be a first sign that the recent plunge was just a 50% retracement level of the 5th June – 10th of July up move. Despite the strong rally, I would keep my neutral stance since the precious metal has to deal with the prior uptrend line and the zone of 1325/32, where it may find strong resistance. On the downside, only a move below 1293 (S3) could confirm a forthcoming lower low and flip the picture negative.
• Support: 1310 (S1), 1305 (S2), 1293 (S3)
• Resistance: 1325 (R1), 1332 (R2), 1345 (R3)
WTI climbs above 103.00

WTI rallied yesterday, breaking above the blue downtrend line and crushing two resistance barriers in a row. The price moved above 101.70 (S2), reached the 103.05 (S1) barrier and after some profit taking near that zone (shown on the 1-hour chart) the bulls regained momentum and drove the battle above the 103.05 hurdle. The picture is now turned positive, in my view, and I expect WTI to challenge the resistance of 104.50 (R1). A clear break of that level could trigger further bullish extensions towards the next obstacle at 106.05 (R2). The MACD turned positive, while the RSI moved above 70, indicating the accelerating bullish momentum. However, zooming on the 1-hour chart, the 14-hour RSI seems ready to exit overbought conditions, while the hourly MACD shows signs of topping and seems ready to move below its signal line. Bearing that in mind, I cannot rule out a pullback before the longs prevail again.
• Support: 103.05 (S1), 101.70 (S2), 101.10 (S3)
• Resistance: 104.50 (R1), 106.05 (R2), 107.30 (R3)
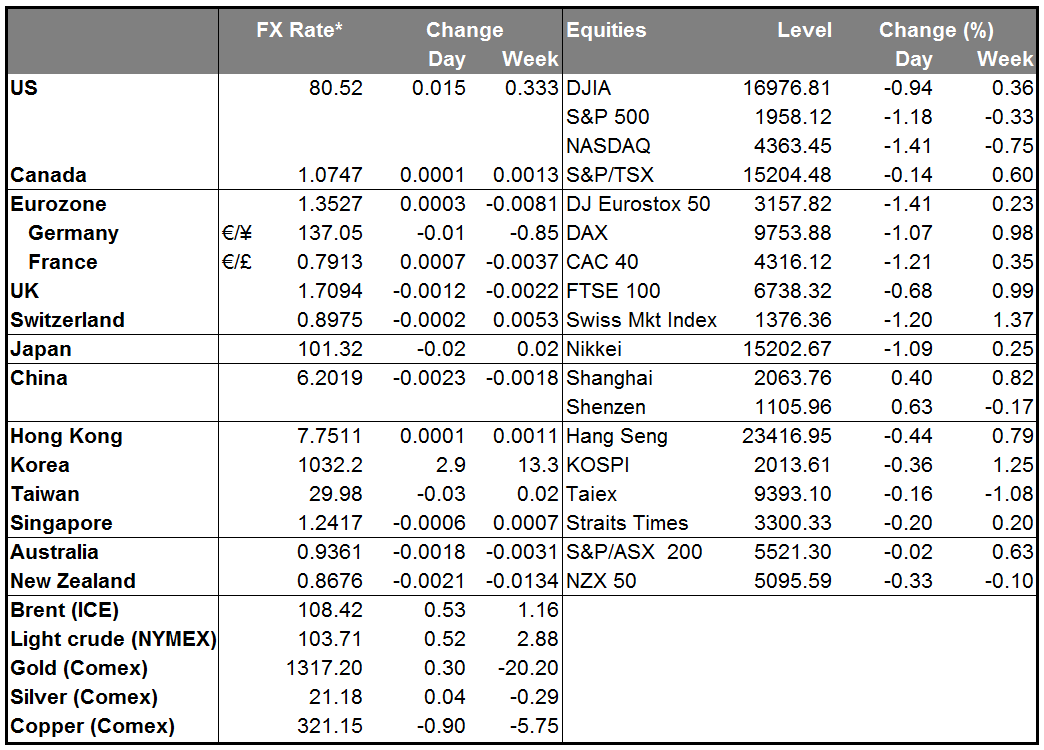
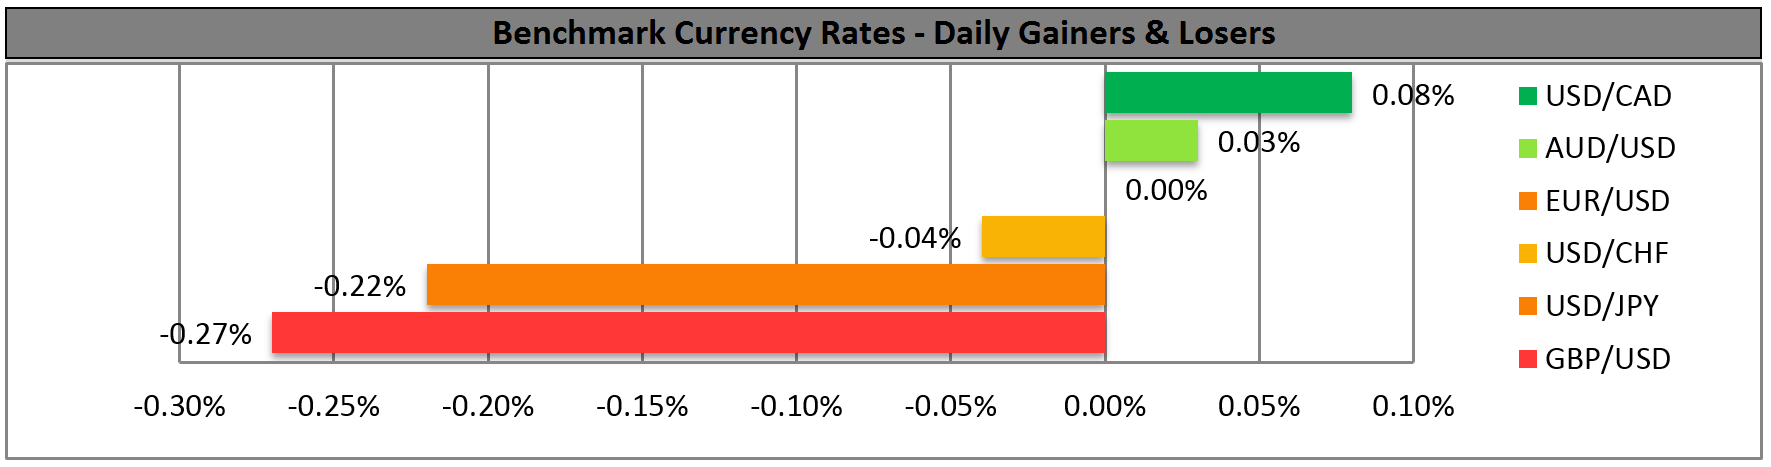
BENCHMARK CURRENCY RATES - DAILY GAINERS AND LOSERS
MARKETS SUMMARY