
Will EUR/USD challenge 1.3000?
EUR/USD moved somewhat higher on Friday, getting closer to the psychological barrier of 1.3000 (R1) and the lower boundary of the prior blue downside channel, connecting the highs and the lows on the daily chart. The MACD continued higher and seems ready to obtain a positive sign, while the RSI crossed above its 50 line. Having these signs in mind, I maintain my view that we may see the rate challenging the psychological line of 1.3000 (R1) as a resistance this time. Nevertheless, on the daily chart, the price structure remains lower highs and lower lows below both the 50- and the 200-day moving averages, thus I still see a negative overall picture and I would consider the recent advances as a corrective phase before sellers take control again. A clear move below 1.2860 (S1), is likely to trigger extensions towards the key support zone of 1.2760 (S2), defined by the lows of March and July 2013.
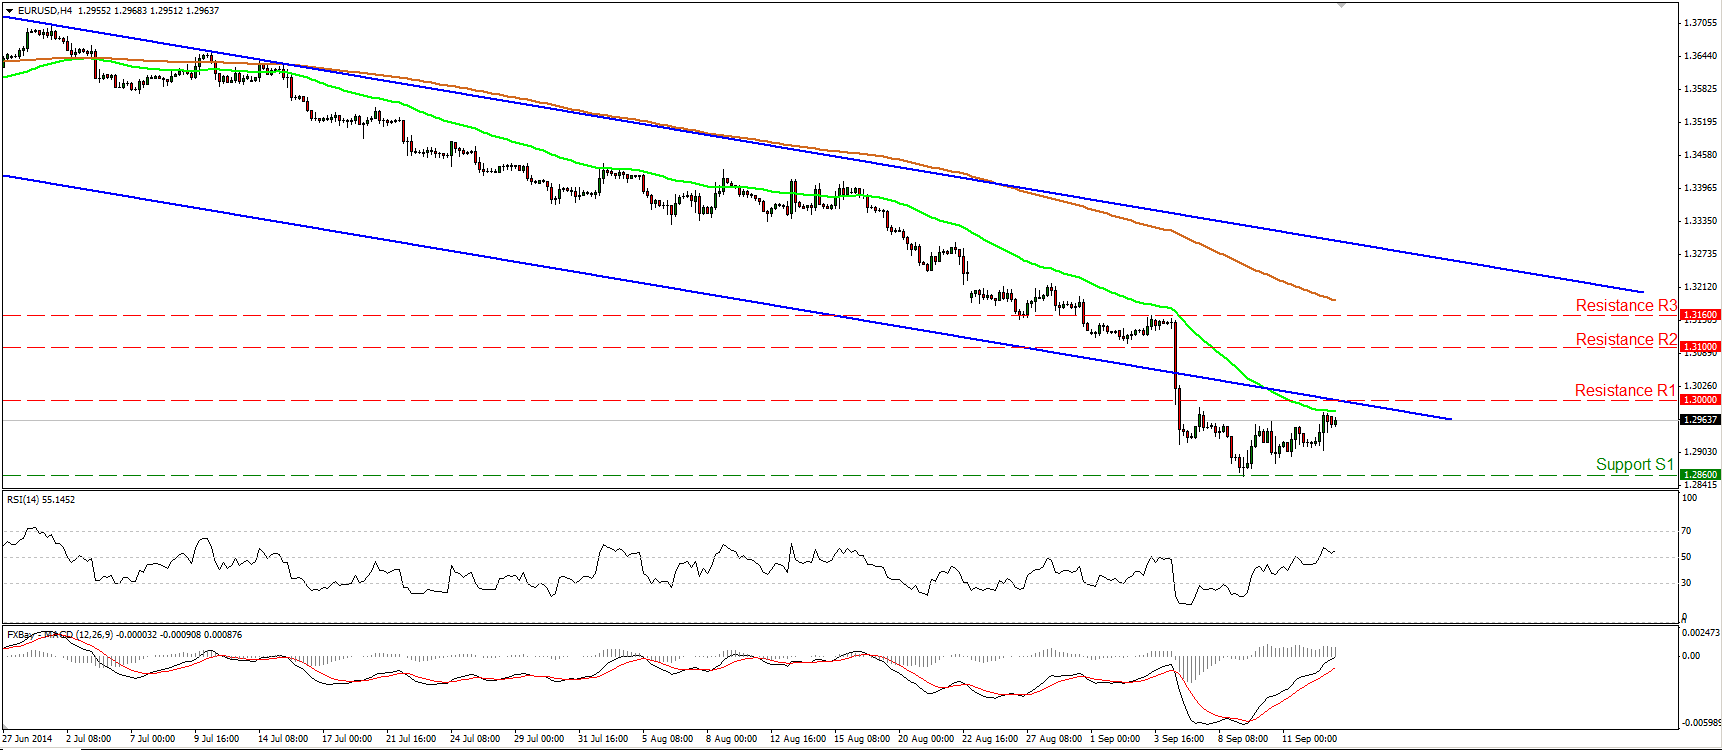
• Support: 1.2860 (S1), 1.2760 (S2), 1.2660 (S3).
• Resistance: 1.3000 (R1), 1.3100 (R2), 1.3160 (R3).
USD/JPY in a consolidative mode above 107.00
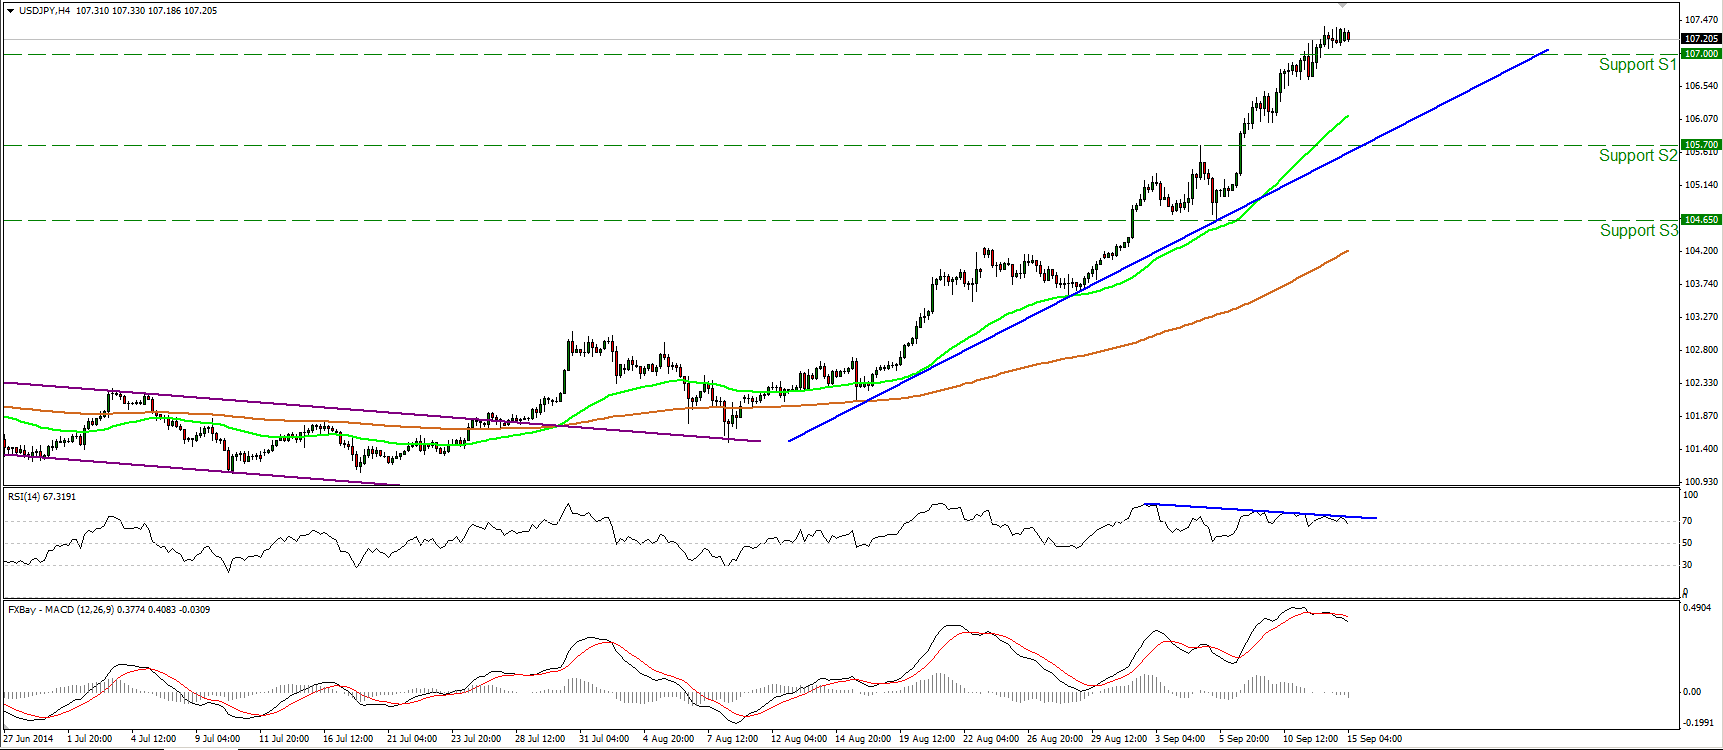
USD/JPY moved in a consolidative mode, maintaining its rate above the 107.00 (S1) barrier. I still expect the pair to extend higher and target the 108.00 (R1) line, defined by the highs of the 19th of September 2008. I will repeat that as long as the price is trading above the blue uptrend line and above both the moving averages, I consider the near-term bias to be to the upside. However, I would be mindful of a possible pullback before the next leg higher. The MACD has topped and moved below its signal line, while I see negative divergence between the RSI and the price action. In the bigger picture, I still see a newborn long-term uptrend, since, after the exit of a triangle, the price structure remains higher highs and higher lows above both the 50- and the 200-day moving averages.
• Support: 107.00 (S1), 105.70 (S2), 104.65 (S3).
• Resistance: 108.00 (R1), 109.00 (R2), 110.00 (R3).
GBP/USD stuck near the 1.6260 barrier
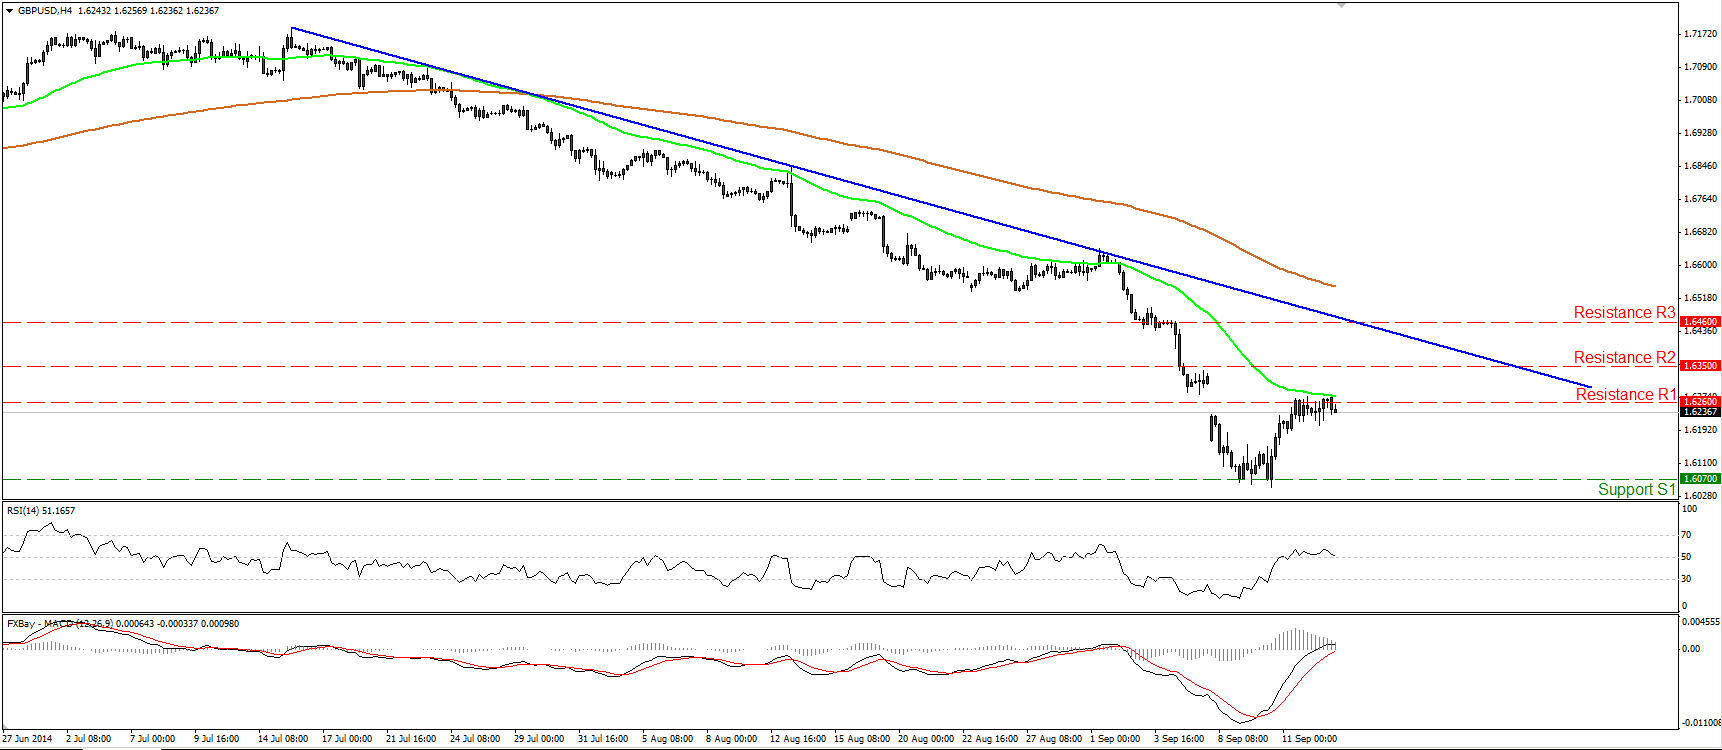
GBP/USD continued trading near the 1.6260 (R1) key line, remaining capped by the 50-period moving average. Taking into account that the price is trading below the blue downtrend line and below both the moving averages, the near-term technical picture remains negative in my view and I would consider the recent advance as a corrective move. Zooming on the 1-hour chart, I see negative divergence between the price action and both our hourly momentum studies, amplifying the case that the next leg could be to the downside. On the daily chart, as long as Cable is forming lower highs and lower lows below the 80-day exponential moving average, the longer-term trend remains to the downside in my opinion. Nevertheless, a few days ahead of the Scottish independence referendum I would prefer to take to the sidelines as the outcome could change the whole picture. I would like to take a view after the results.
• Support: 1.6070 (S1), 1.6000 (S2), 1.5870 (S3).
• Resistance: 1.6260 (R1), 1.6350 (R2), 1.6460 (R3).
Gold finds support at 1225
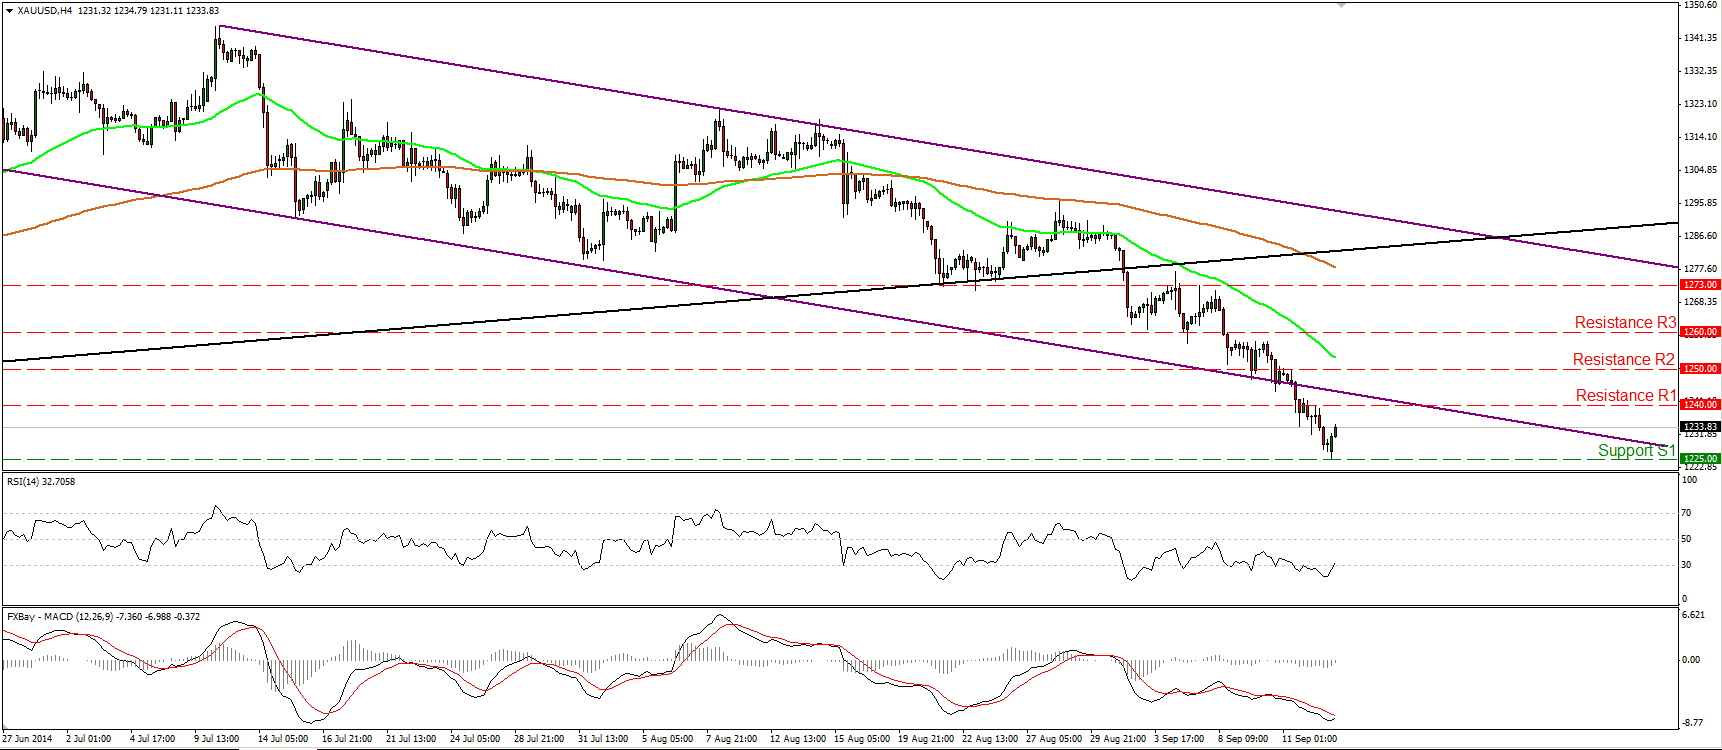
Gold continued declining on Friday, but the price triggered some buy orders near 1225 (S1) and rebounded to trade virtually unchanged. I still see a negative technical structure, but I would wait for a dip below 1220 (S2) before expecting the next leg lower. Such a move could pave the way for the critical obstacle of 1200 (S3). Shifting our attention to our momentum studies, the RSI exited its oversold field, while the MACD snows signs of bottoming and could cross above its trigger any time soon. Taking these momentum signs into account, I would be cautious about the continuation of the corrective move, perhaps to challenge the 1240 (R1) zone as a resistance, before the bears pull the trigger again.
• Support: 1225 (S1), 1220 (S2), 1200 (S3).
• Resistance: 1240 (R1), 1250 (R2), 1260 (R3).
WTI not choosing a direction
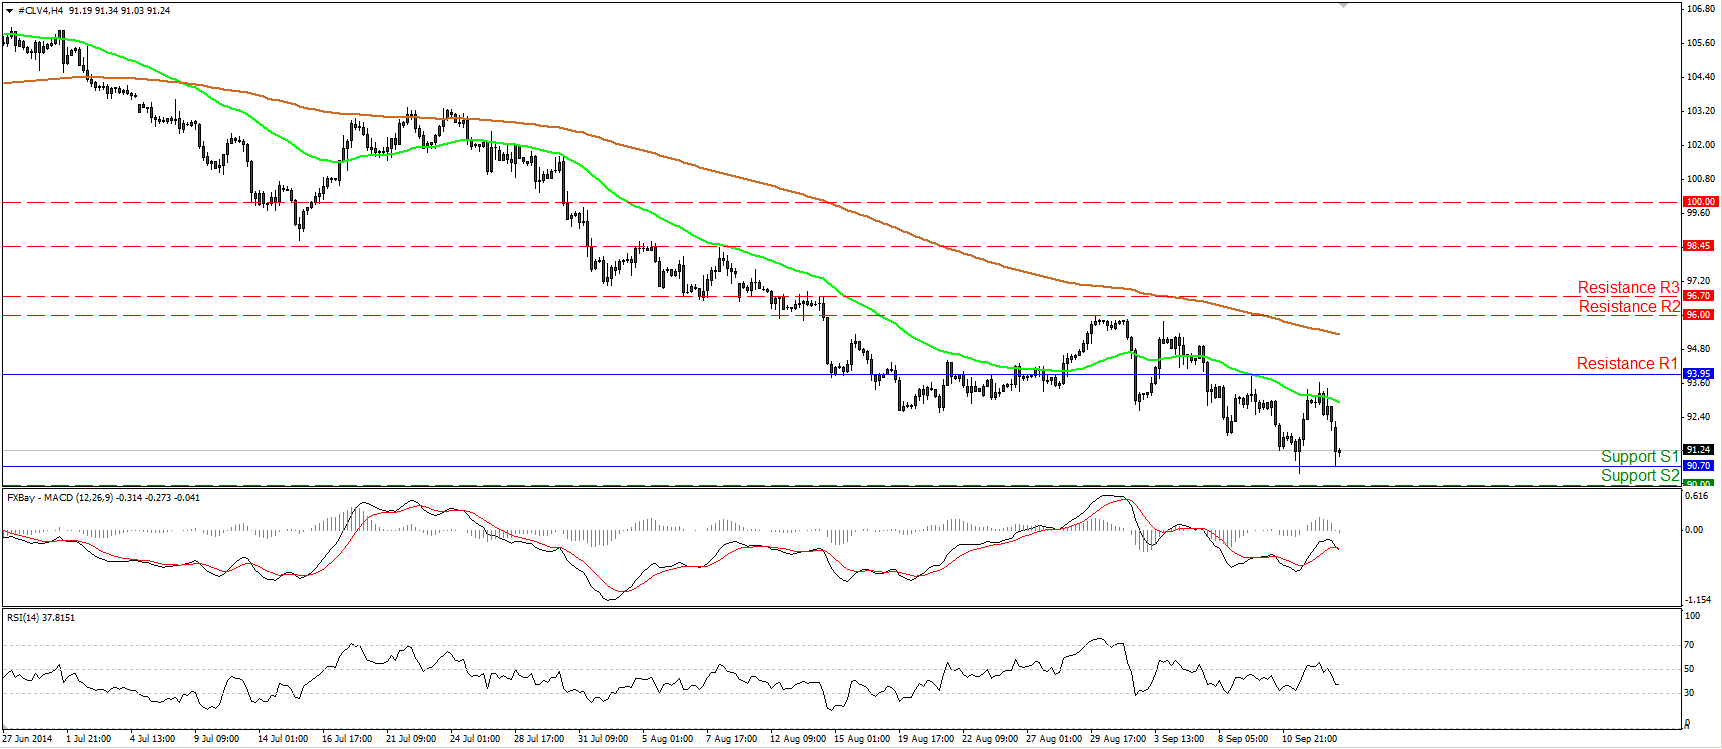
WTI declined on Friday after finding resistance below our 93.95 (R1) barrier. I would remain neutral for now, as the price oscillates between the aforementioned resistance and the support of 90.70 (S1). I would wait for a move below the psychological level of 90.00 (S2), before shifting my attention to the downside. Such a break is likely to trigger extensions to the 85.75 (S3) area, defined by the lows of the 18th of April 2013. On the other hand I will stick to the view that only a clear move above 93.95 (R1) could flip the bias to the upside, perhaps towards our next resistance at 96.00 (R2).
• Support: 90.70 (S1), 90.00 (S2), 85.75 (S3).
• Resistance: 93.95 (R1), 96.00 (R2), 96.70 (R3) .
BENCHMARK CURRENCY RATES - DAILY GAINERS AND LOSERS

MARKETS SUMMARY
