Today is the Assumption of Mary a public holiday for most European countries, US, Australia, Canada which means that liquidity will be at lower than usual levels in the forex market. Still there are important economic news to be released such as the Inflation Rate in UK, the US Retail Sales, the Trade Balance in Japan and the Consumer Confidence in Australia which can add increased volatility in the market due to the absence of normal liquidity.
These are the key economic events which can move the forex market today to focus on, time is GMT:
European Session
UK: Core Inflation Rate YoY, Inflation Rate (YoY, MoM), Germany: Bundesbank Beermann Speech
Time: 08:30, 16:00
The Core Inflation Rate is a measure of price movements for various goods and services. Core Inflation Rate excludes seasonally volatile products such as food and energy in order to capture a more accurate calculation or real inflationary pressures in the broader economy. The forecasts are for an unchanged yearly Core Inflation Rate in UK at 1.9%, a decline for the monthly Inflation Rate at -0.1% compared to the previous reading of 0.0% and an increase for the yearly Inflation Rate at 2.5% compared to the previous figure of 2.4%. Higher than expected readings for the Inflation Rate in UK are considered positive and supportive as they could weigh on the Bank of England to apply a tighter monetary policy in the future, increasing further they key interest rate.
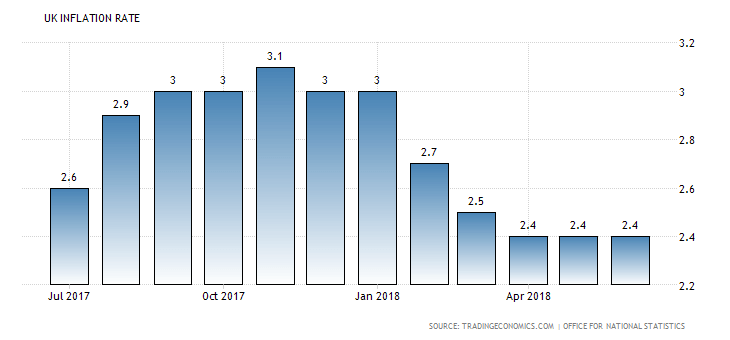
“Consumer price inflation in the UK stood at an annual rate of 2.4 percent in June 2018, unchanged from the previous month and below market expectations of 2.6 percent. June’s rate remained at the lowest level since March 2017. Prices of both transport and housing & utilities rose at a faster pace while inflation slowed for recreation & culture and food & non-alcoholic beverages.”, Source: Trading Economics.

For the past three consecutive months the Inflation Rate in UK has stabilized at the rate of 2.4%.
American Session
US: Retail Sales ex Autos MoM, Retail Sales MoM, NY Empire State Manufacturing Index, Unit Labour Costs QoQ, Prel, Nonfarm Productivity QoQ Prel, Industrial Production (YoY, MoM), NAHB Housing Market Index, Business Inventories MoM, EIA Crude Oil Stocks Change, EIA Gasoline Stocks Change, Foreign Bond Investment, Net Long-Term Tic Flows, Overall Net Capital Flows
Time: 12:30, 13:15, 14:00, 14:30, 20:00
The Retail Sales figure measures the total receipts of retail stores. Changes in Retail Sales are an indicator of consumer spending with higher readings considered positive for the US Dollar as consumer spending is a key driver of economic growth measured by the GDP level. The monthly US Retail Sales are expected to decline at 0.1%, lower than the previous figure of 0.5%, while a decline is expected also for the monthly Retail Sales excluding Autos at 0.3%, lower than the previous figure of 0.4%.
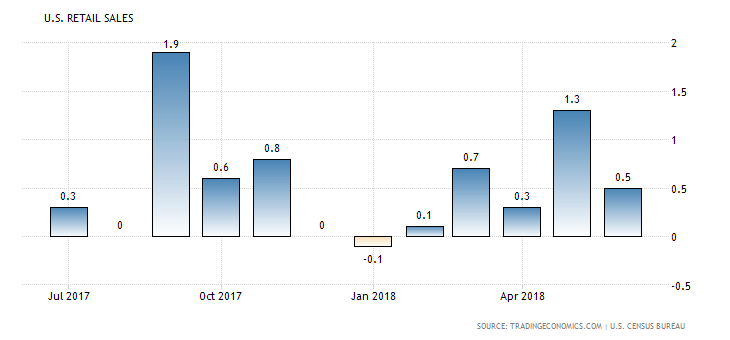
“US retail trade rose by 0.5 percent month-over-month in June 2018, following an upwardly revised 1.3 percent advance in May and matching market expectations. June’s gains were boosted by increases in purchases of motor vehicles and a range of other goods.”, Source: Trading Economics.

As seen from the chart the monthly US Retail Sales exhibit increased volatility and have an undefined trend with significant increases and declines for the past 12 months.
For the rest of the US economic data mixed figures are expected overall. NY Empire State Manufacturing Index measures the general business conditions in the manufacturing sector at the New York State. Higher readings or rising ones indicate improved business conditions and are positive for the US Dollar. Manufacturing Production is a measure of a month-on-month change in the manufacturing output of the United States, an indicator whose figures investors get a hint at manufacturing conditions in the United States.
NAHB Housing Market Index is a monthly Index released by The National Association of Home Builders (NAHB), which measures the level of home sales. Higher than expected reading are positive for the US dollar reflecting a strong housing market and a positive future economic outlook. Net Long-Term TIC Flows is a monthly economic release from the US department of Treasury, which measures the Treasury International Capital, and inflows or outflows of capital in the United States. Higher than expected readings are positive for the US Dollar, indicating higher demand for the US Dollar from foreign holders of US securities. In theory a weaker dollar should attract more International Capital inflows are the US securities are now cheaper for the foreign holders or investors.
The higher US interest rates should also be supportive for the US Dollar and the Capital Inflows in the United States. The business inventories measure the monthly percentage changes in inventories from manufacturers, retailers, and wholesalers. Non-farm Productivity indicates the overall business health in the US, which has an influence on the total economic growth.
For all the above-mentioned economic data higher than expected readings are considered positive for the US Dollar. The NAHB Housing Market Index, the Business Inventories, the monthly Industrial Production and the NY Empire State Manufacturing Index are expected to decline while the Nonfarm Productivity is expected to increase.
The EIA Crude Oil Stocks Change measure the weekly change in the number of barrels of commercial crude oil held by US firms, a figure which influences the price of petroleum products having an impact on inflation. If the increase in crude inventories is more than expected, then this implies a weaker than demand and is considered negative or bearish for crude oil prices. The same holds true if a decline in inventories is less than expected.
Pacific Session
Australia: Westpac Consumer Confidence, Wage Price Index (YoY, QoQ) (Q2)
Time: 00:30, 01:30
The Consumer Sentiment Index measures the level of consumer confidence reflecting views on future political policy and economic conditions. Confidence figures are often leading indicators for the consumer spending and the economy with higher than expected figures considered positive for the Australian Dollar. The Wage Price Index is an indicator of labor cost inflation that the Reserve Bank of Australia pays close attention to when taking into consideration the key interest rates. Again, higher readings are considered supportive for the Australian Dollar. The forecasts are for a decline of the Consumer Sentiment Index at 103 lower than the previous reading of 106.1 and a marginal increase for both the yearly and quarterly Wage Price Index.
Asian Session
Japan: Balance of Trade
Time: 23:50
The Trade Balance is a measure of balance amount between import and export. A positive value shows a trade surplus and is considered positive for the Japanese Yen indicating capital inflows in Japan and increased demand for goods and services denominated in Japanese Yen which in economic theory may lead to the appreciation of the currency against other currencies in the future. The forecast is for a figure of Yen 50.B, much less than the previous figure of Yen 720.B.
Trade Forex
