Today the forex market economic calendar is relatively light in economic events. There is still
high uncertainty in the forex market and the financial markets about the trade war and
Brexit developments and the potential of Canada to join the trade deal between US and
Mexico or not. Any new tariffs imposed or not may influence the risk sentiment of investors.
These are the main economic events in the forex market today, time is GMT:
European Session
Eurozone: ECB President Draghi Speech, ECB Nouy Speech
Time: 08:15, 08:30
A Speech by the ECB President is always important as President’s comments may determine positive or negative the Euro’s trend in the short-term. Usually, if he shows a hawkish outlook, it is positive for the Euro while a dovish is seen as negative.
American Session
US: NAHB Housing Market Index, Net Long-Term Tic Flows, Overall Net Capital Flows, API Crude Oil Stock Change
Time: 20:00, 20:30
The NAHB Housing Market Index presents home sales and expected home buildings in the
future indicating housing market trend in the United States. The growth rate of the housing
market affects the US economy as the housing market is an indicator of the direction of the
economy. A higher than expected reading shows a robust housing market and is positive for
the US Dollar.
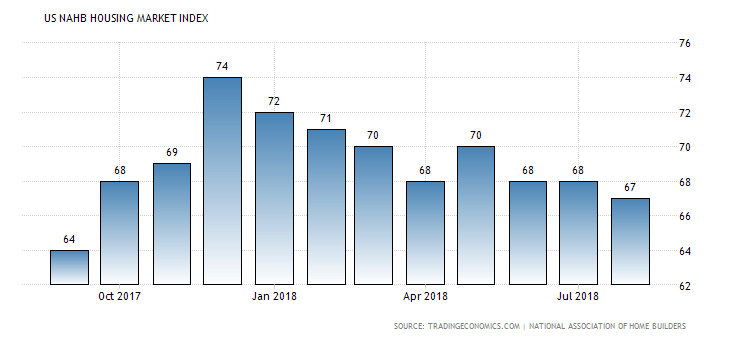
“The NAHB Housing Market Index fell to 67 in August 2018 from 68 in the
previous month, as widely expected by markets. It was the lowest reading since September
last year, due to declines in all components: current single-family home sales (73 vs 74 in
July); prospective buyers (49 vs 51); and home sales over the next six months (72 vs 73).”,
Source: Trading Economics.

As seen from the chart the US NAHB Housing Market Index has stabilized in the range 67-68
for the past three months, and a decrease to 66 from 67 is expected.
The Net Long-Term Tic Flows summarize the flow of stocks, bonds, and money market funds
to and from the United States, with an important focus on the US Treasury bonds whose
yield, especially the 10-yr bond yield is a barometer for the US fixed income market. A
positive figure is positive for the US Dollar as it reflects capital inflows which can support
trade deficits, whereas capital outflows are indicative of a weaker demand for US assets
which in general puts downward pressure on the value of the US Dollar.
An increase to 65.1B US Dollars from -36.5B US Dollars is expected for the Net Long-Term Tic Flows figure. The American Petroleum Institute reports inventory levels of US crude oil, gasoline and distillates stocks, an overview of US petroleum demand. If the increase in crude oil
inventories is more than expected, then this implies a weaker than expected demand and is
considered negative for crude oil prices. The same can be said if a decline in crude oil
inventories is less than expected.
Pacific Session
Australia: House Price Index (YoY, QoQ), (Q2), RBA Meeting’s Minutes, New Zealand: Westpac Consumer Confidence
Time: 01:30, 21:00
The House Price Index shows changes in housing in Australia and is considered as a key
indicator for inflationary pressures. A high reading is positive for the Australian Dollar,
reflecting a robust housing market while a low reading is seen as negative. An unchanged
quarterly reading of -0.7% is expected for the second quarter and a yearly decrease to -0.7%
from 2.0% for the same quarter.
The minutes of the Reserve Bank of Australia give a full account of the policy discussion,
including differences of view. In general, if the RBA is hawkish about the inflationary outlook for the economy, and the economic outlook, then the markets may place a higher possibility
of an interest rate increase, which should be positive for the Australian Dollar.
A higher than expected reading for the New Zealand Consumer Confidence is considered
positive for the New Zealand Dollar as it reflects increased optimism in the overall economy,
and possible higher future consumer spending, a key driver of economic growth.
Asian Session
Japan: Balance of Trade
Time: 23:50
The Trade Balance is a measure of balance amount between imports and exports. A positive
value shows a trade surplus while a negative value shows a trade deficit. A trade surplus is
positive for any given currency, indicating capital inflows in the specific country, Japan and
increased demand for goods and services denominated in Japanese Yen, which may lead to
the natural appreciation of the Japanese Yen over time. The Yen is considered also a haven
currency, so it is also affected by the investor’s preference towards risk.
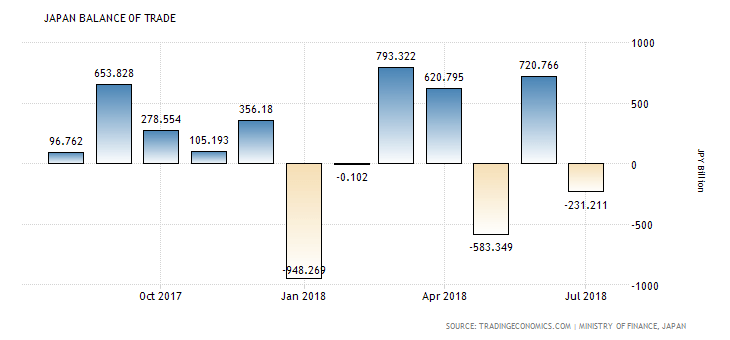
“Japan recorded a trade deficit of JPY 231 billion in July of 2018, compared to a JPY 407
billion surplus in the same month a year ago and to market consensus of a JPY 50 billion gap.
Exports rose by 3.9 percent to JPY 6.75 trillion, down from a 6.7 percent rise in June and
below expectations of a 6.3 percent gain. Meantime, imports jumped 14.6 percent to JPY
6.98 trillion, up from a 2.6 percent growth in June and slightly above market consensus of a
14.4 percent rise.”, Source: Trading Economics.

As seen from the above chart the Japanese Trade Balance is highly volatile, having both
surpluses and deficits in the past 12-months. A wider trade deficit of -468.7B Yen is expected
from -231B Yen, which may weigh negatively on the Yen.
Start Trading Forex
