The US Advance Goods Trade Balance and Consumer Confidence Index, and Consumer Confidence in Italy and France are in the spotlight today in the forex market. The economic data released today is mostly related to the US economy, so moderate to high volatility should be expected for the US Dollar versus other currencies.
These are the main economic events in the forex market today to focus on, time is GMT:
European Session
France: Consumer Confidence, Italy: Consumer Confidence, Business Confidence
Time: 06:45, 08:00
Higher than expected readings for the Consumer and Business Confidence in France and Italy are considered positive for the Euro indicating the current business conditions and assessment of important economic indicators such as labor market conditions and prospects for income growth. Both Confidence Indexes can indicate the performance of the overall economy in a short-term view. The forecasts are for an unchanged reading of 97 for the Consumer Confidence in France and decreases for the Consumer Confidence and Business Confidence in Italy to 115.9 and 106.2 respectively from 116.3 and 106.9 accordingly.
“The manufacturing confidence index in Italy stood at 106.9 in July 2018, unchanged from the previous month’s 16-month low and slightly above market expectations of 106.5. Output outlook improved (13.6 vs 12.4 in June) despite a further deterioration in orders level (-5.6 vs -3.6). Also, there was a decline in inventories (3.1 vs 3.8). The composite business morale index, combining surveys of the manufacturing, retail, construction and services sectors, eased to 105.4 in July from 105.5 in June, with strong gains in the building sector offsetting declining confidence in retail and services.”, Source: Trading Economics.

The Business Confidence in Italy has peaked so far in 2018 in February at 110.1 and has decreased ever since reaching the lowest reading of 106.9 in 2018 for the past two consecutive months reflecting a weak trend. A lower Business Confidence Index reading can have negative effects on the employment, business investing and the economic growth.
American Session
US: Wholesale Inventories, Goods Trade Balance, S&P/Case-Schiller Home Price index YoY, CB Consumer Confidence, API Crude Oil Stock Change
Time: 12:30, 13:00, 14:00, 20:30
The monthly Goods trade Balance is the difference in value between imported and exported goods. A trade surplus is considered positive for the US Dollar reflecting higher exports than imports, and capital inflows in the US economy which can lead to the appreciation of the US Dollar versus other currencies as demand for the currency is high. The forecast is for a wider trade deficit of -68.60B US Dollars, compared to the previous reading of – 67.92B US Dollars.
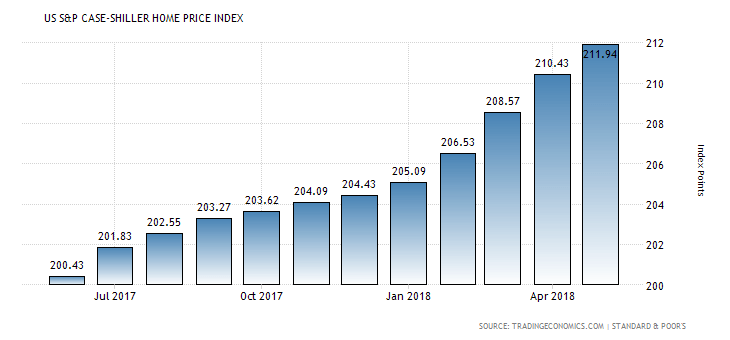
The Wholesale Inventories Wholesale measure the change in the total value of goods held in inventory by wholesalers while the S&P/Case-Schiller Home Price index tracks changes in the value of the residential real estate market in 20 regions across the US, being an important indicator for the health of the US housing market. Higher than expected readings for the S&P/Case-Schiller Home Price index and lower than expected for the Wholesale Inventories are considered positive for the US Dollar reflecting a robust housing market with inflationary pressures in the economy and suggesting that there is no economic slowing at present.
The Conference Board (CB) Consumer Confidence measures the level of consumer confidence in economic activity, being a leading indicator as it can predict consumer spending, which can stimulate economic activity and growth measured by the GDP level. A higher than expected reading is considered positive for the US Dollar.
“The S&P CoreLogic Case-Shiller 20-City Composite Home Price Index in the US rose 6.5 percent year-on-year in May 2018, following an upwardly revised 6.7 percent advance in April and beating market expectations of 6.4 percent. Seattle recorded the biggest increase (13.6 percent), followed by Las Vegas (12.6 percent) and San Francisco (10.9 percent). Meanwhile, the national index, covering all nine US census divisions rose 6.4 percent in May, the same pace as in the previous month.”, Source: Trading Economics.

The US S&P Case-Shiller Home Price Index is showing a strong uptrend as of July 2017, providing support for the broader economy in terms of optimism, inflationary pressures and the state of latest economic and business cycles.
The American Petroleum Institute reports inventory levels of US crude oil, gasoline and distillates stocks. The figure shows how much oil and product is available in storage providing an overview of US petroleum demand. If the increase in crude inventories is more than expected, then this implies a weaker than expected demand and is considered negative for crude oil prices, while the same applies if a decline in inventories is less than expected.
The forecasts are for an unchanged yearly reading of 6.5% for the S&P/Case-Shiller Home Price Index, an unchanged reading for the monthly Wholesale Inventories at 0.1%, and a decrease for the CB Consumer Confidence Index to 126.5 from 127.4.
Trade Forex Here
