
North Korea tensions and dovish Fed talk support gold prices
Geopolitical tensions and diminishing prospects for another Fed interest rate hike this year are bullish for gold. Will XAUUSD continue rising?
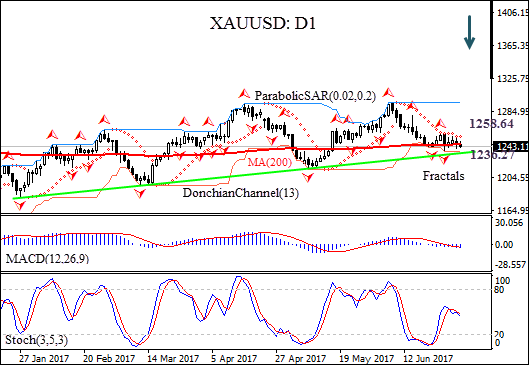
The XAUUSD: D1 has risen above the 200-day and 50-day moving averages MA(200) and MA(50) on the daily chart, which are both rising.
- The Donchian channel indicates no trend yet: it is flat.
- The MACD indicator is above the signal line and the gap is widening, this is bulliish.
- The Parabolic indicator gives a buy signal.
- The stochastic oscillator is falling back from the overbaught zone.
We believe the bullish momentum will continue after the price closes above the upper Donchian boundary at $1344.23. A pending order to buy can be placed above that level. The stop loss can be placed below the fractal low at $1299.17. After placing the order, the stop loss is to be moved every day to the next fractal high, following Parabolic signals. Thus, we are changing the probable profit/loss ratio to the breakeven point. The most risk-averse traders may switch to the 4-hour chart after the trade and place there a stop-loss moving it in the direction of the trade. If the price meets the stop loss level ($1299.17) without reaching the order ($1344.23), we recommend canceling the position: the market sustains internal changes which were not taken into account.
Summary of technical analysis:
| Position | Buy |
| Buy stop | Above 1344.23 |
| Stop loss | Below 1299.17 |