
Preparing for the release of important statistics
In this review, we suggest considering the personal composite instrument (PCI) "XAUAUD". It reflects the price dynamics of gold against the Australian dollar. Is the growth of XAUAUD prices possible?
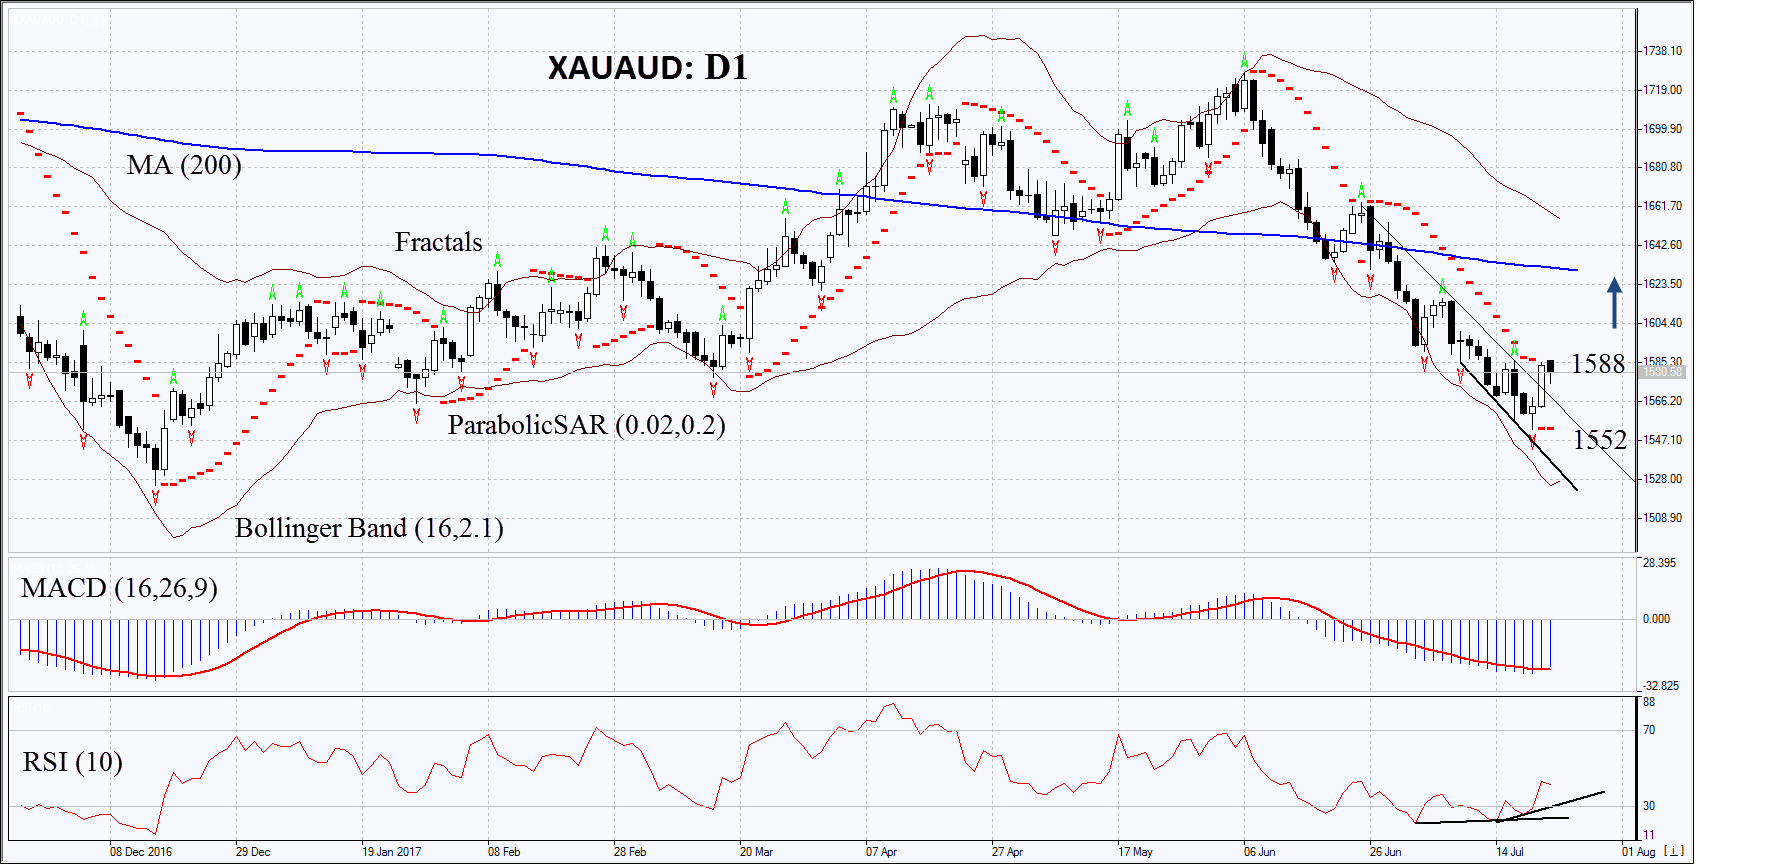
On the daily timeframe, XAUAUD: D1 has edged up from the downtrend. The further price increase is possible in case of an increase in the world prices of gold, as well as in case of the worsening of the Australian economic indicators.
- The Parabolic indicator gives a bullish signal.
- The Bollinger bands have markedly widened, which means higher volatility. The lower line is tilted upwards.
- The RSI is below 50. It has formed a positive divergence.
- The MACD gives a bullish signal.
The bullish momentum may develop in case XAUAUD exceeds the last fractal high at 1588. This level may serve as an entry point. The initial stop loss may be placed below the last fractal low and the Parabolic signal at 1552. After opening the pending order, we shall move the stop to the next fractal low following the Bollinger and Parabolic signals. Thus, we are changing the potential profit/loss to the breakeven point. More risk-averse traders may switch to the 4-hour chart after the trade and place there a stop loss moving it in the direction of the trade. If the price meets the stop level at 1552 without reaching the order at 1588 we recommend cancelling the position: the market sustains internal changes that were not taken into account.
Summary of technical analysis:
| Position | Buy |
| Buy stop | above 1588 |
| Stop loss | below 1552 |