
India may increase purchases of silver
According to the GFMS forecast, silver imports to India may increase by 40% this year compared to 2016. Will the silver prices grow?
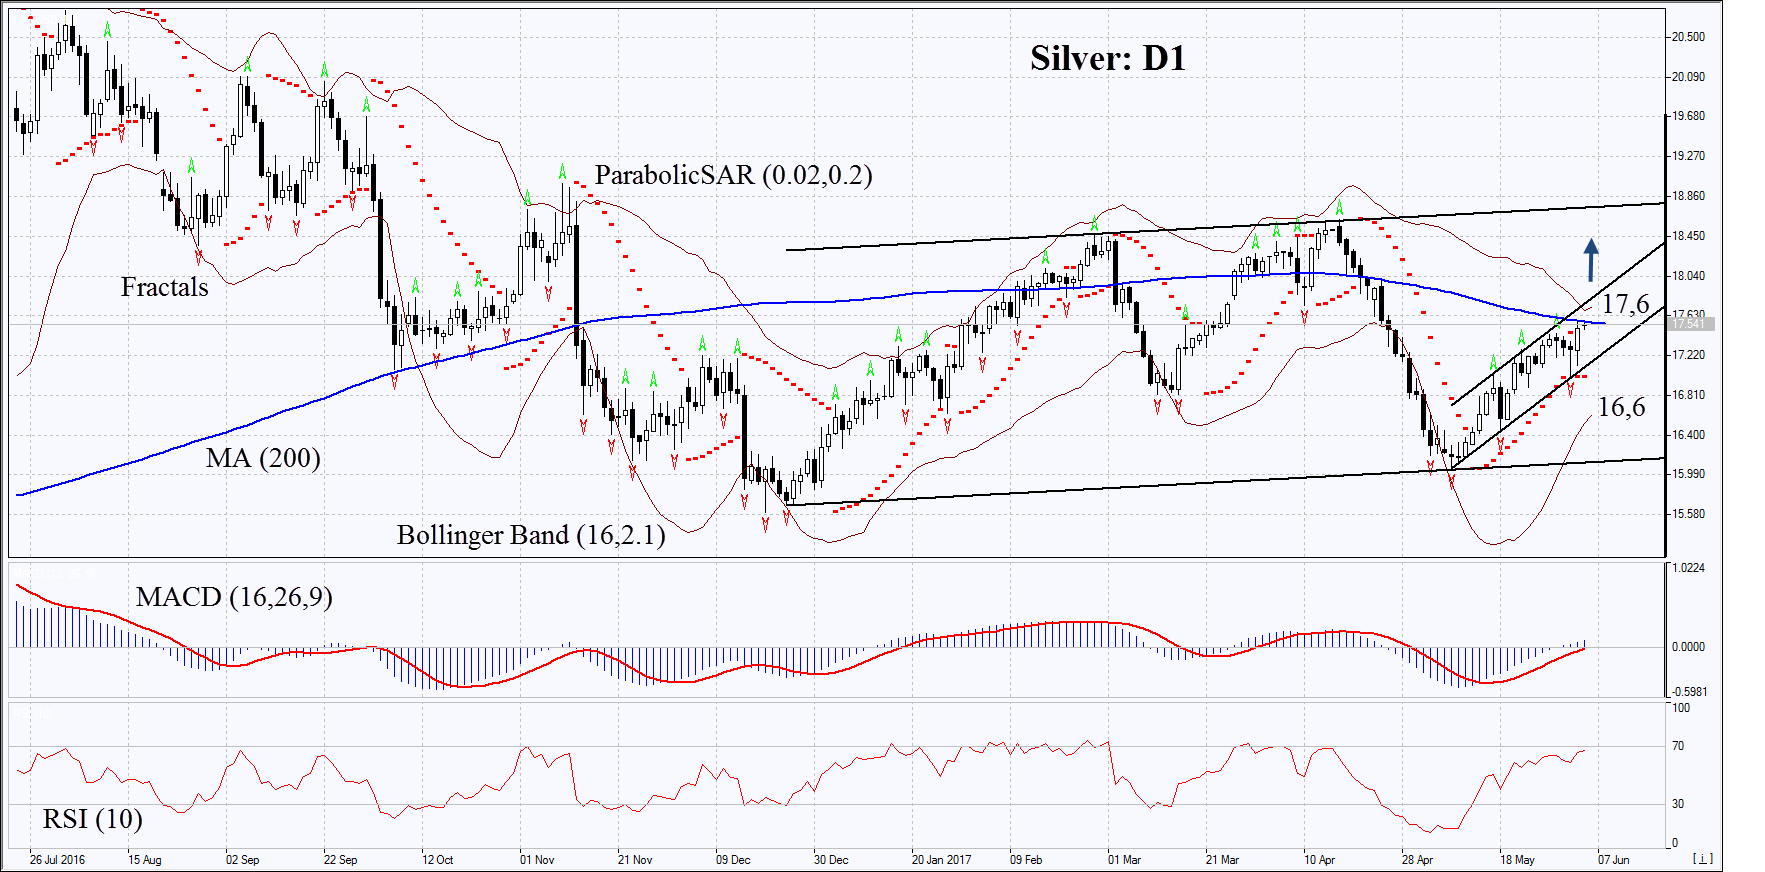
On the daily timeframe, XAGUSD: D1 is in a rising trend. The further price increase is possible in case of a reduction in production and an increase in global demand, including the alternative energy.
- The Parabolic indicator gives a bullish signal.
- The Bollinger bands have narrowed, which means low volatility. They are tilted upwards.
- The RSI Indicator is above 50. No divergence.
- The MACD Indicator gives a bullish signal.
The bullish momentum may develop in case Silver exceeds the 200-day moving average line and the last fractal high at 17.6. This level may serve as an entry point. The initial stop loss may be placed below the last fractal low, the Parabolic signal and the lower Bollinger band at 16.6. After opening the pending order, we shall move the stop to the next fractal low following the Bollinger and Parabolic signals. Thus, we are changing the potential profit/loss to the breakeven point. More risk-averse traders may switch to the 4-hour chart after the trade and place there a stop loss moving it in the direction of the trade. If the price meets the stop level at 16.6 without reaching the order at 17.6 we recommend cancelling the position: the market sustains internal changes that were not taken into account.
Summary of technical analysis:
| Position | Buy |
| Buy stop | Above 17,6 |
| Stop loss | Below 16,6 |