
Fed policy tightening bearish for Swiss franc
Swiss central bank is expected to maintain expansionary policy stance with data indicating falling household spending and disinflation. Will the Swiss franc continue falling?
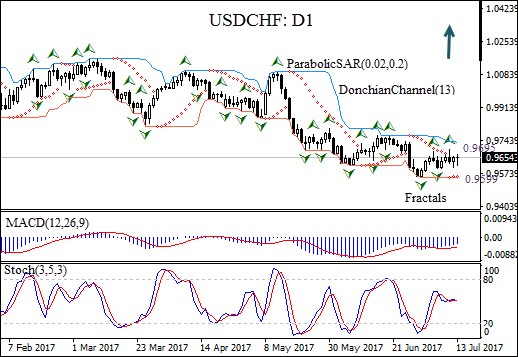
The USDCHF is rising on the daily chart after hitting seven month low two weeks ago.
- The Parabolic indicator gives a buy signal.
- The Donchian channel signals no trend has formed yet: the channel is flat.
- The MACD indicator is below the signal and the gap is falling, which is a bullish signal.
- The stochastic oscillator is falling, but hasn’t reached the oversold zone.
We believe the bullish momentum will continue after the price breaches above the last fractal high at 0.9695. This level can be used as an entry point for a pending order to buy. The stop loss can be placed below the fractal low at 0.9599. After placing the order, the stop loss is to be moved every day to the next fractal low, following Parabolic signals. Thus, we are changing the probable profit/loss ratio to the breakeven point. If the price meets the stop loss level without reaching the order, we recommend cancelling the position: the market sustains internal changes which were not taken into account.
Summary of technical analysis:
| Position | Buy |
| Buy stop | Above 0.9695 |
| Stop loss | Below 0.9599 |