
Lower growth outlook bearish for New Zealand dollar
Policy proposals to limit immigration, tax capital gains and restrict foreign ownership of properties are expected to hurt growth outlook of New Zealand economy. Will the NZDUSD continue falling?
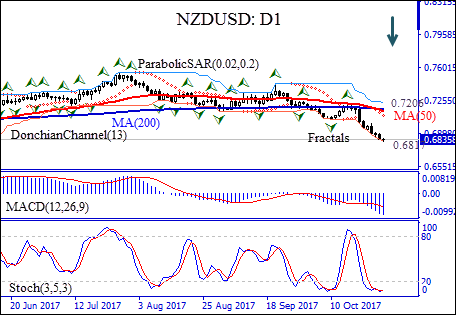
The NZDUSD: D1 accelerated the decline following the coalition formation between the Labour and New Zealand First parties on October 19. The 50-day and 200-day moving averages MA(50) and MA(200) have formed the bearish Death Cross chart pattern on daily timeframe.
- The Donchian channel indicates downtrend: it is tilted down.
- The MACD indicator gives a bearish signal: it is below the signal line and the gap is widening.
- The Parabolic indicator gives a sell signal.
- The stochastic oscillator gives a bullish signal: it is in the oversold zone.
We believe the bearish momentum will continue after the price breaches below the lower Donchian boundary at 0.6817. A pending order to sell can be placed below that level. The stop loss can be placed above the last fractal high at 0.7206. After placing the order, the stop loss is to be moved every day to the next fractal high, following Parabolic signals. Thus, we are changing the probable profit/loss ratio to the breakeven point. The most risk-averse traders may switch to the 4-hour chart after the trade and place there a stop-loss moving it in the direction of the trade. If the price meets the stop loss level (0.7206) without reaching the order (0.6817), we recommend canceling the position: the market sustains internal changes which were not taken into account.
Summary of technical analysis:
| Position | Buy |
| Buy stop | Below 0.6817 |
| Stop loss | Above 0.7206 |