
New Zealand dollar strengthens with rising exports
The New Zealand dollar is rising with strong demand of country’s exports. Will the New Zealand dollar continue strengthening?
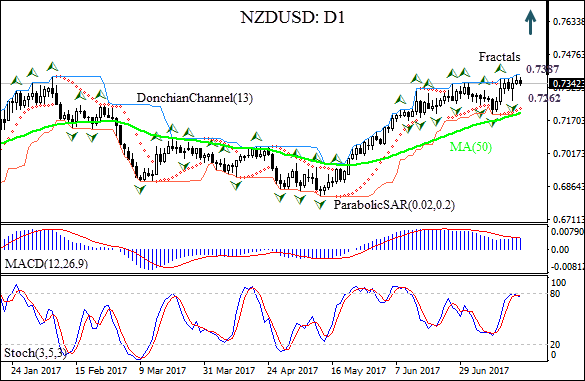
The NZDUSD: D1 has been correcting upward since hitting 12-month low in the beginning of May on the daily chart. The price is above the 50-day moving average MA(50) which is rising.
- The Donchian channel indicates uptrend: it is tilted upward.
- The MACD indicator is neutral.
- The Parabolic indicator gives a buy signal.
- The stochastic oscillator has reached the boundary of the overbought zone.
We believe the bullish momentum will continue after the price closes above the upper Donchian boundary at 0.7387. A pending order to buy can be placed above that level. The stop loss can be placed below the last fractal low at 0.7262. After placing the order, the stop loss is to be moved every day to the next fractal low, following Parabolic signals. Thus, we are changing the probable profit/loss ratio to the breakeven point. The most risk-averse traders may switch to the 4-hour chart after the trade and place there a stop-loss moving it in the direction of the trade. If the price meets the stop loss level ($0.7262) without reaching the order ($0.7387), we recommend canceling the position: the market sustains internal changes which were not taken into account.
Summary of technical analysis:
| Position | Buy |
| Buy stop | Above 0.7387 |
| Stop loss | Below 0.7262 |