
Weak data are bearish for Nikkei
Falling trade surplus and weaker private investment expectations are bearish for Nikkei. Will NIKKEI continue falling?
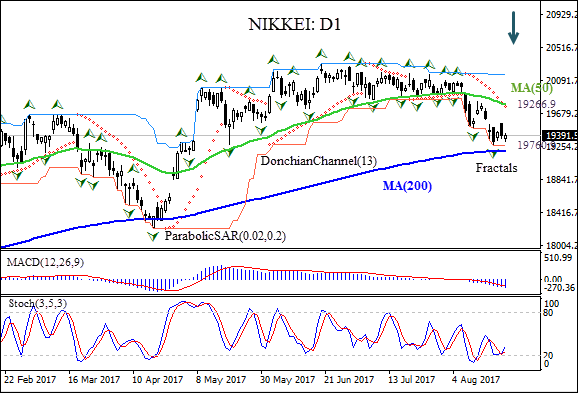
On the daily chart, the NIKKEI: D1 has been falling last couple of weeks after trading in narrow range since the beginning of June. The price has fallen below the 50-day moving average MA(50) toward the 200-day moving average MA(200).
- The Donchian channel indicates no downtrend yet: it is flat.
- The Parabolic indicator gives a sell signal.
- The MACD indicator gives a bearish signal: it is below the signal line and the gap is widening.
- The Stochastic oscillator is rising bust has not reached the overbought zone.
We believe the bearish momentum will continue after the price closes below the lower Donchian bound at 19266.90, confirmed also by fractal low. A pending order to sell can be placed below that level. The stop loss can be placed at Parabolic signal at 19760.90. After placing the pending order the stop loss is to be moved every day to the next fractal low, following Parabolic signals. Thus, we are changing the probable profit/loss ratio to the breakeven point. More conservative traders can switch to the 4-hour chart and move the stop-loss in the direction of the trade. If the price meets the stop loss level (19760.90) without reaching the order(19266.90), we recommend cancelling the position: the market sustains internal changes which were not considered.
Summary of technical analysis:
| Position | Sell |
| Sell stop | Below 19266.90 |
| Stop loss | Above 19760.90 |