
Awaiting tax reform by Donald Trump
45th US President Donald Trump will make his maiden speech to the joint session of the US Congress on Tuesday. Will it trigger the downward correction of Nasdaq 100 stock index if his speech disappoints lawmakers?
Donald Trump is expected to present the details of his law reform and infrastructure projects. Their main aim is to stimulate the US production by massive tax cuts on businesses and individuals. US stock indices previously were advancing almost without retracements and have repeatedly hit their fresh historical highs. Investors were optimistic on the economic program of the US president. Nevertheless, the disclosure of the details may make them book profits. The program realization may begin in the 2nd part of 2017. As the US saying goes, “buy rumours – sell facts”. On Tuesday many significant US economic indicators will come out which may affect the markets. At 16-30 СЕТ the Q4 2016 GDP will come out in 2nd reading, as well as the trade balance and wholesale stocks for January. At 18-00 СЕТ the consumer confidence index for February will come out. We believe that the tentative outlook is mostly positive. Thus, Nasdaq 100 may retrace in case the real figures fall short of expectations or in case of negative reaction of the markets on the Trump’s policy.
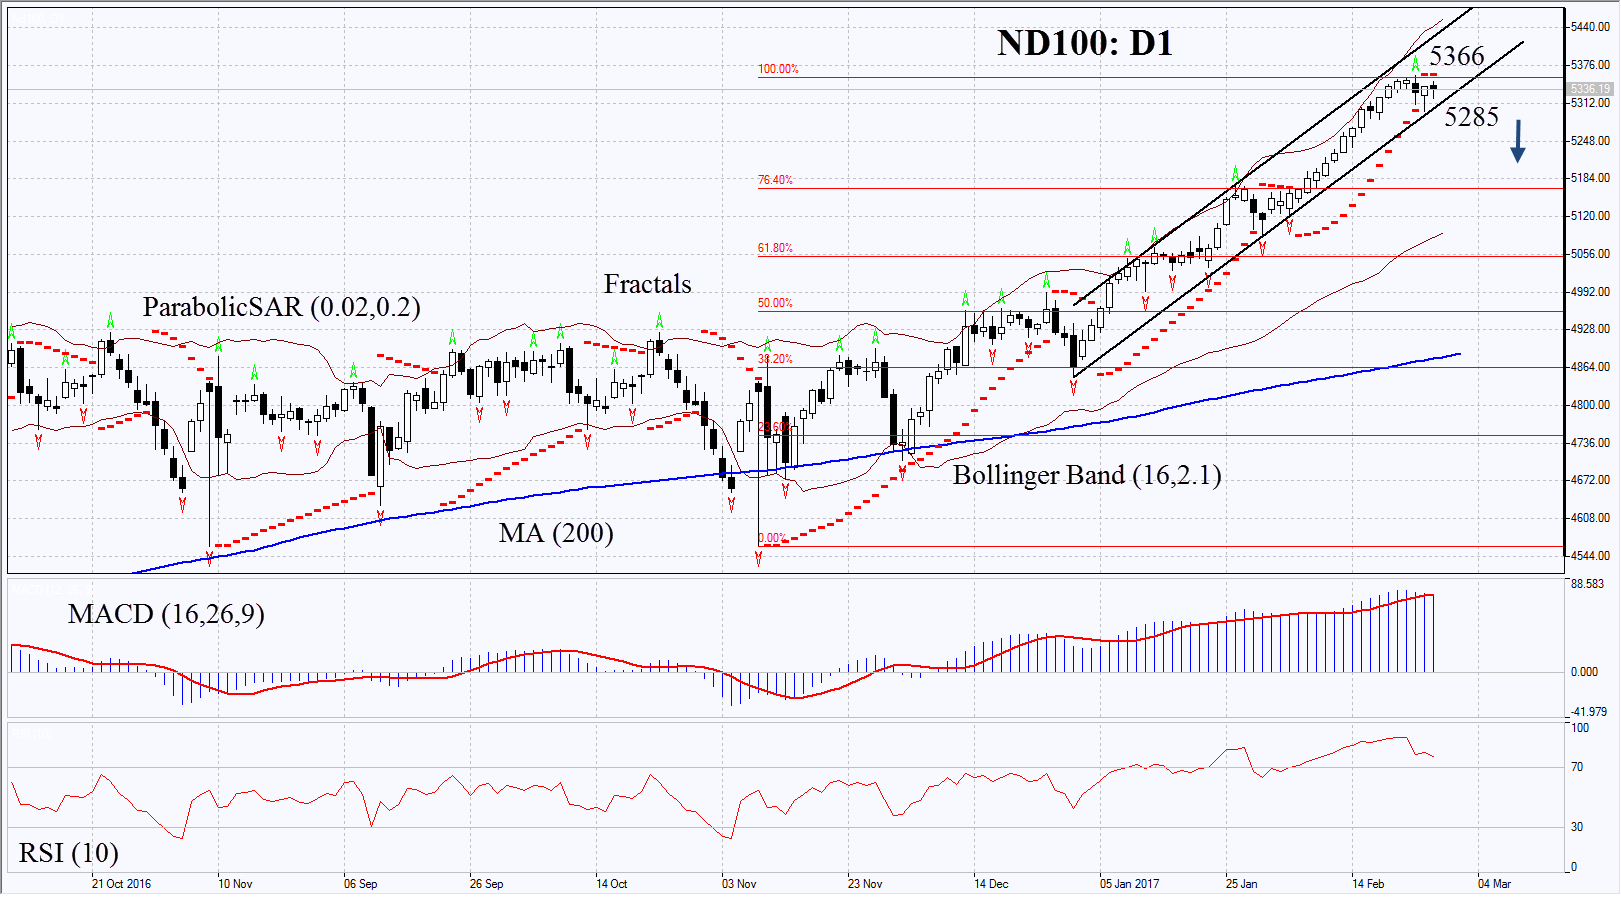
On the daily chart ND100: D1 continues being in the rising channel. To open the position its lower boundary shall be broken down through. Its pace of growth has slowed down and several technical indicators have formed signals to sell. Prices may fall in case of negative economic data in US and if investors book their profits after the details of the new economic program are revealed.
- The Parabolic indicator gives bearish signals.
- The Bollinger bands have widened which means higher volatility.
- The RSI is close to the overbought zone, no divergence.
- The MACD is giving bearish signals.
The bearish momentum may develop in case ND100 falls below the low of the previous week and the lower boundary of the rising channel at 5285. This level may serve the point of entry. The initial stop-loss may be placed above the Parabolic signal and the last fractal high at 5366. Having opened the pending order we shall move the stop to the next fractal high following the Parabolic and Bollinger signals. Thus, we are changing the probable profit/loss ratio to the breakeven point. The most risk-averse traders may switch to the 4-hour chart after the trade and place there a stop-loss moving it in the direction of the trade. If the price meets the stop-loss level at 5366 without reaching the order at 5285, we recommend cancelling the position: the market sustains internal changes which were not taken into account.
Summary of technical analysis:
| Position | Sell |
| Sell stop | below 5285 |
| Stop loss | above 5366 |