
Rising inflation supports British Pound
UK inflation rose 2.9% in August, above expected 2.8% gain. Will the British Pound continue strengthening?
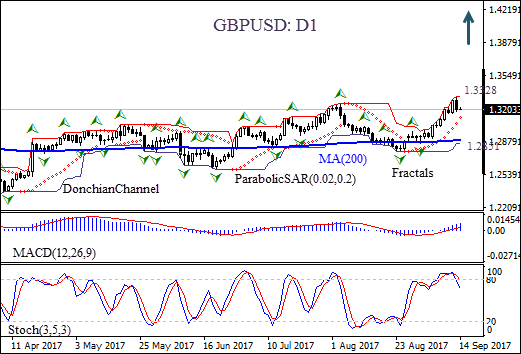
On the daily chart the GBPUSD: D1 is above the 200-day moving average MA(200).
- The Donchian channel indicates an uptrend, it is tilted up.
- The MACD indicator is above the signal line and the gap is widening, which is a bullish signal.
- The Parabolic indicator gives a buy signal.
- The stochastic oscillator has fallen back from the overbought zone.
We believe the bullish movement will continue after the price breaches above the upper Donchian boundary at 1.3328. It can be used as an entry point for a pending order to buy. The stop loss can be placed below the fractal low at 1.2851. After placing the pending order the stop loss is to be moved every day to the next fractal low, following Parabolic signals. Thus, we are changing the probable profit/loss ratio to the breakeven point. If the price meets the stop-loss level (1.2851) without reaching the order (1.3328) we recommend cancelling the position: the market sustains internal changes which were not taken into account.
Summary of technical analysis:
| Position | Buy |
| Buy stop | Above 1.3328 |
| Stop loss | Below 1.2851 |