
Election uncertainty weighs on British Pound
UK economy slowed in the first quarter and uncertainty about June 8 general election persists. Will the British Pound continue weakening?
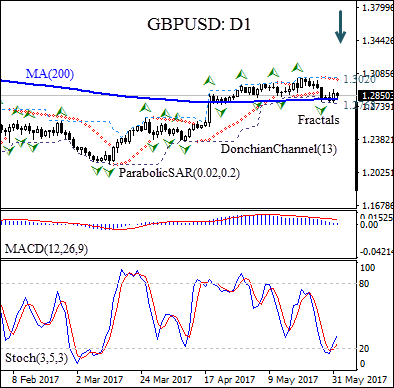
On the daily chart the GBPUSD: D1 is testing the 200-day moving average MA(200).
- Parabolic indicator gives a sell signal.
- The Donchian channel is tilting lower, indicating a downtrend.
- The MACD indicator is above the signal line and the gap is falling, which is a bearish signal.
- The stochastic oscillator is rising but has not reached the overbought zone.
We believe the bearish movement will continue after the price breaches below the lower Donchian bound at 1.2768. It can be used as an entry point for a pending order to sell. The stop loss can be placed above the Parabolic signal at 1.3020. After placing the pending order the stop loss is to be moved every day to the next fractal high, following Parabolic signals. Thus, we are changing the probable profit/loss ratio to the breakeven point. If the price meets the stop-loss level (1.3020) without reaching the order (1.2768) we recommend cancelling the position: the market sustains internal changes which were not taken into account.
Summary of technical analysis:
| Position | Sell |
| Sell stop | Below 1.2768 |
| Stop loss | Above 1.3020 |