
In the current and next years, the Fed is going to raise rates 4 more times
At the previous meeting on June 15, 2017, the US Federal Reserve raised the base interest rate by 25 basis points to 1-1.25%. This contributed to the strengthening of the US dollar. Will the EURUSD fall?
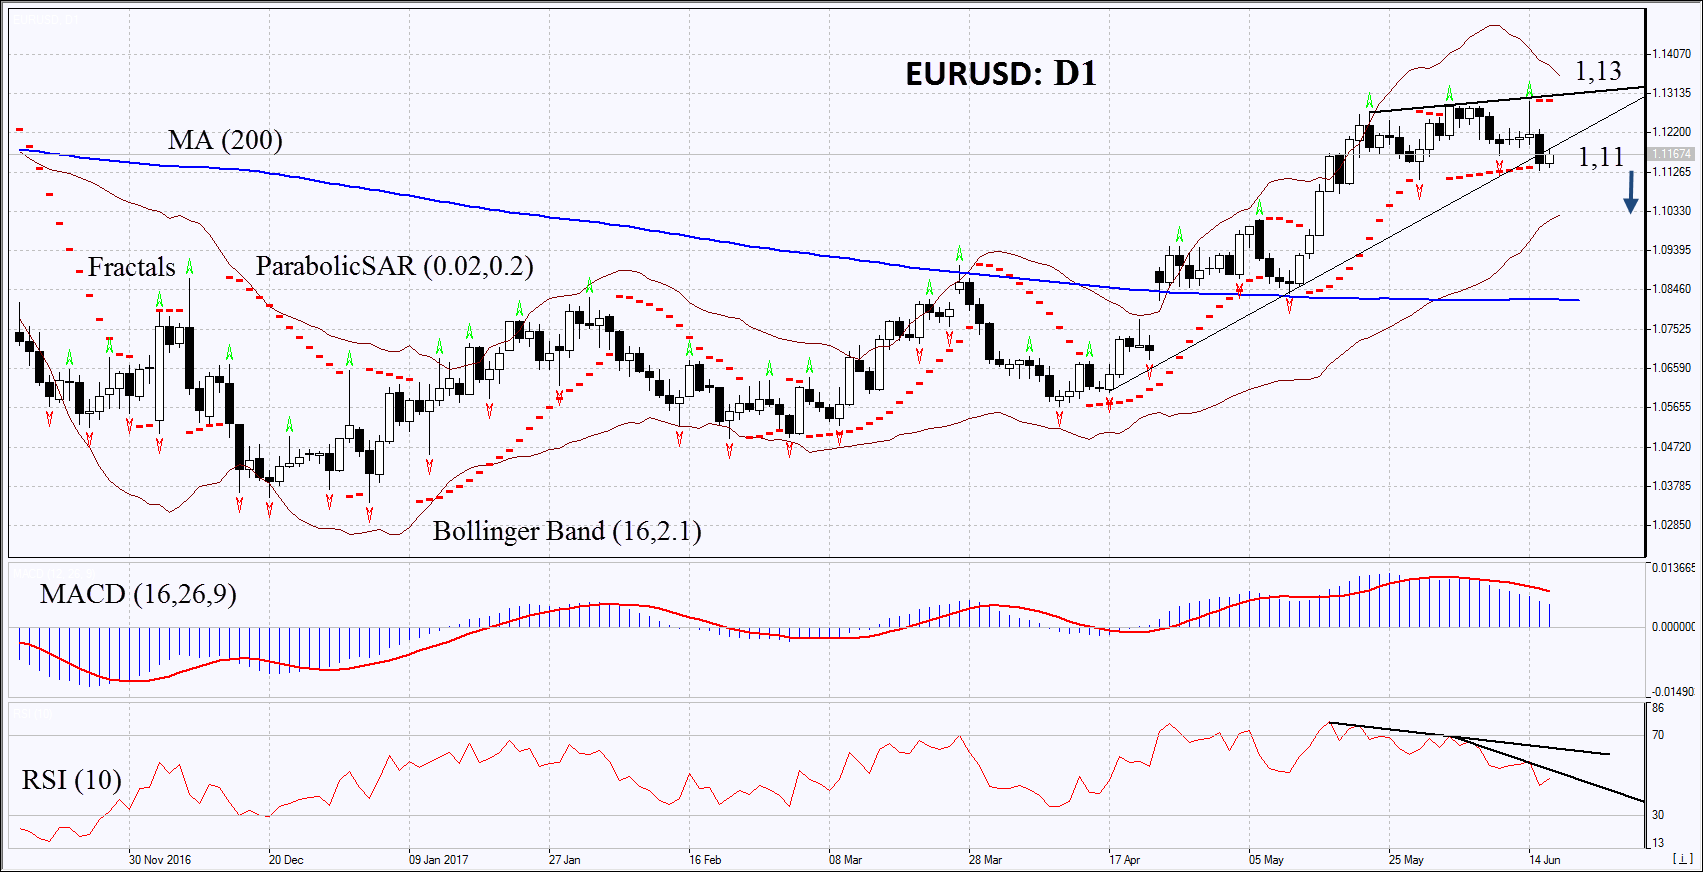
On the daily timeframe, EURUSD: D1 left the rising trend. A downward correction is possible in case of the worsening of economic indicators in the Eurozone and improvement of economic indicators in the USA.
- The Parabolic indicator gives a bearish signal.
- The Bollinger bands have narrowed, which indicates low volatility.
- The RSI Indicator is below 50. It has formed double negative divergence.
- The MACD Indicator gives a bearish signal.
The bearish momentum may develop in case EURUSD falls below the last fractal low at 1.11. This level may serve as an entry point. The initial stop-loss may be placed above the last fractal high, the 7-month maximum and the Parabolic signal at 1.13. After placing the pending order, we shall move the stop to the next fractal high following the Bollinger and Parabolic signals. Thus, we are changing the potential profit/loss to the breakeven point. More risk-averse traders may switch to the 4-hour chart after the trade and place there a stop-loss moving it in the direction of the trade. If the price meets the stop level 1.13 without reaching the order at 1.11, we recommend cancelling the position: the market sustains internal changes that were not taken into account.
Summary of technical analysis:
| Position | Sell |
| Sell stop | Below 1,11 |
| Stop loss | Above 1,13 |