
Preparing for the ECB meeting
The European Central Bank may announce about tapering of its monetary stimulus program for the EU economy at its next meeting on October 26, 2017. Will the EU50 prices fall ?
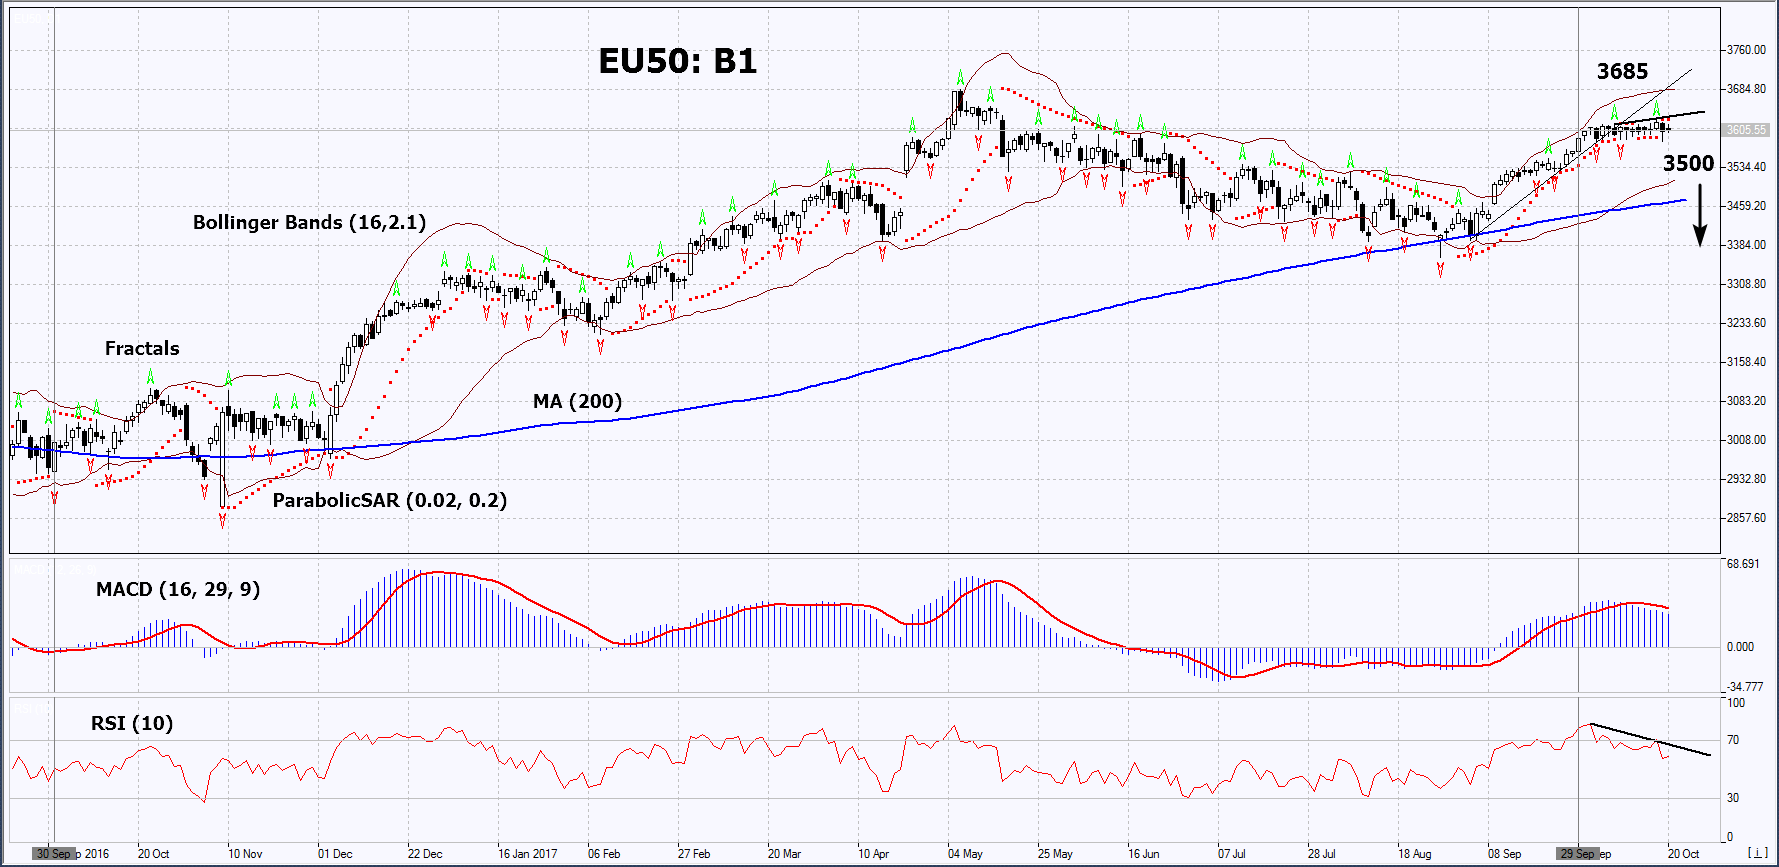
On the daily timeframe, EU50: D1is in a neutral trend. A full-fledge downward correction is possible in case of a reduction in the quarterly aggregate profit of European companies, as well as in case of tapering ECB programs to stimulate the EU economy.
- The Parabolic indicator gives a bearish signal.
- The Bollinger bands have widened, which indicates high volatility.
- The RSI Indicator is above 50. It has formed a negative divergence.
- The MACD Indicator gives a bearish signal.
The bearish momentum may develop in case EU50 falls below the 4 fractal lows and the lower Bollinger band at 3500. This level may serve as an entry point. The initial stop loss may be placed above the two-year high, the upper Bollinger band and the Parabolic signal at 3685. After opening the pending order, we shall move the stop to the next fractal high following the Bollinger and Parabolic signals.Thus, we are changing the potential profit/loss to the breakeven point. More risk-averse traders may switch to the 4-hour chart after the trade and place there a stop loss moving it in the direction of the trade. If the price meets the stop level at 3685 without reaching the order at 3500, we recommend cancelling the position: the market sustains internal changes that were not taken into account.
Summary of technical analysis:
| Position | Sell |
| Sell stop | Below 3500 |
| Stop loss | Above 3685 |