
Higher political risks in Europe
The European stocks decline in price for the 4th consecutive day amid higher political risks in Italy, Greece and the United Kingdom. Will the decrease of the Euro STOXX50 index continue?
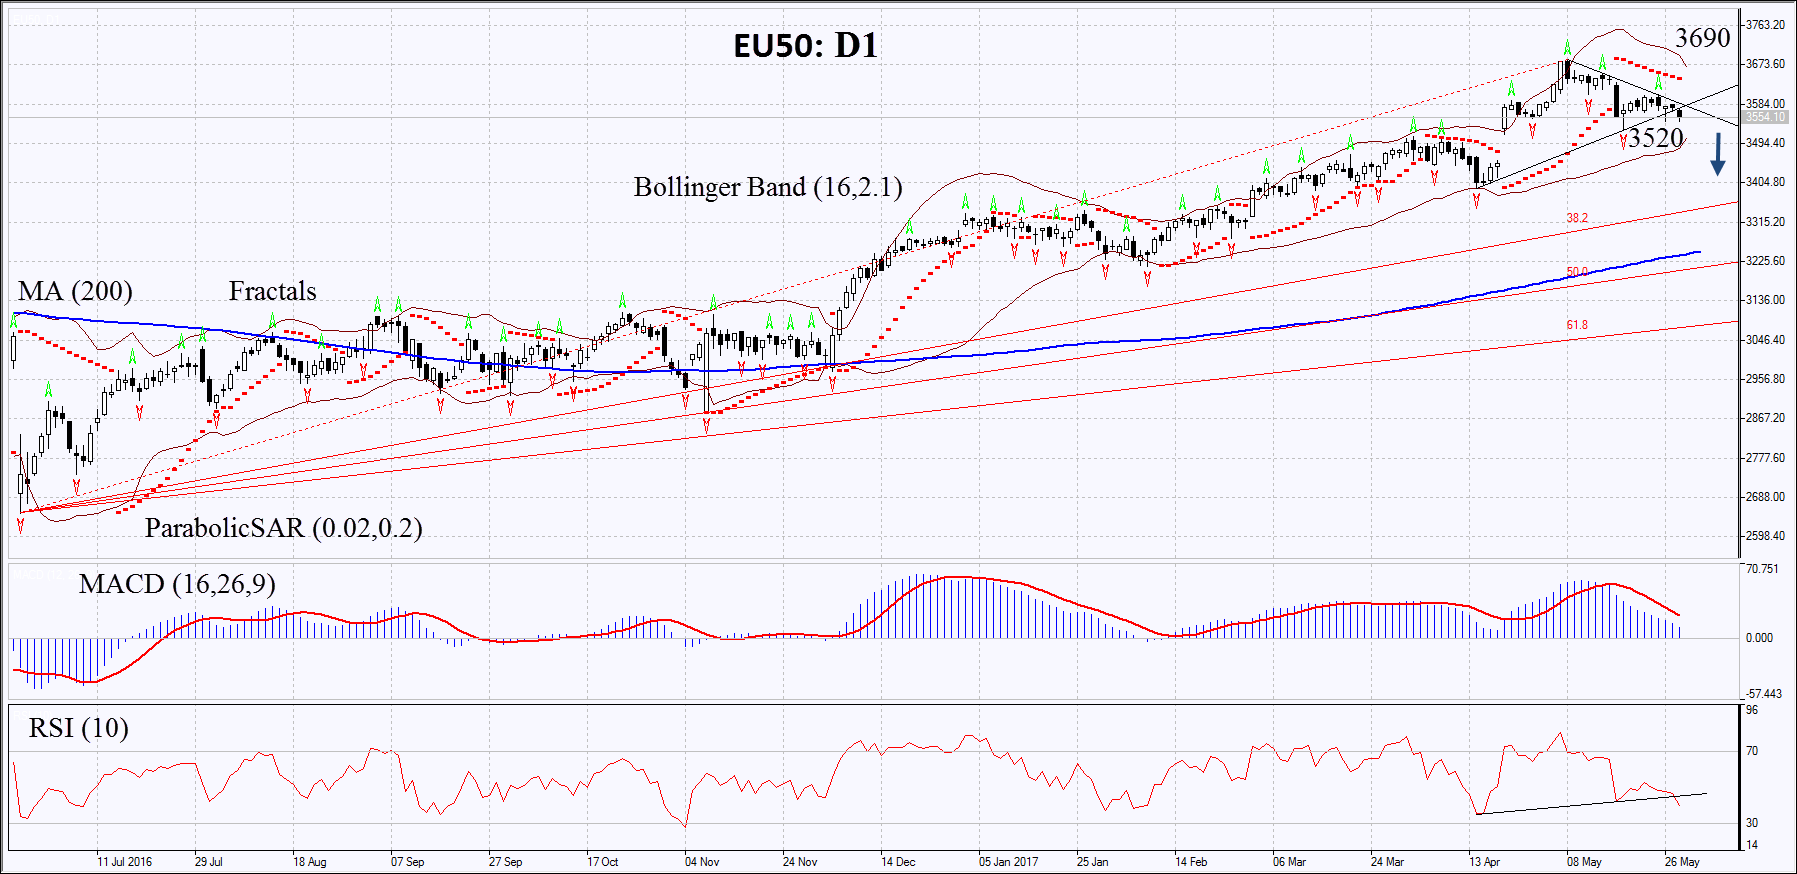
On the daily timeframe, EU50: D1 broke down through the support line of the rising channel and is trying to correct down. The further price decrease is possible in case of the publication of weak economic data in the Eurozone, negative corporate reports and higher political risks.
- The Parabolic indicator gives a bearish signal.
- The Bollinger bands have narrowed, which means lower volatility.
- The RSI is below 50. No divergence.
- The MACD gives a bearish signal.
The bearish momentum may develop in case EU50 drops below the last fractal low at 3520. This level may serve as the entry point. The initial stop loss may be placed above the 3 last fractal highs, the 2-year high, the Parabolic signal and the upper Bollinger band at 3690. After opening the pending order, we shall move the stop to the next fractal high following the Bollinger and Parabolic signals. Thus, we are changing the potential profit/loss to the breakeven point. More risk-averse traders may switch to the 4-hour chart after the trade and place there a stop loss moving it in the direction of the trade. If the price meets the stop level at 3690 without reaching the order at 3520 we recommend cancelling the position: the market sustains internal changes that were not taken into account.
Summary of technical analysis:
| Position | Sell |
| Sell stop | below 3520 |
| Stop loss | above 3690 |