
Bayerische Motoren Werke increased car sales
BMW Group increased car sales both in June 2017 and in the first half of the year, and also published a good operating report. Will the BMW stock prices grow?
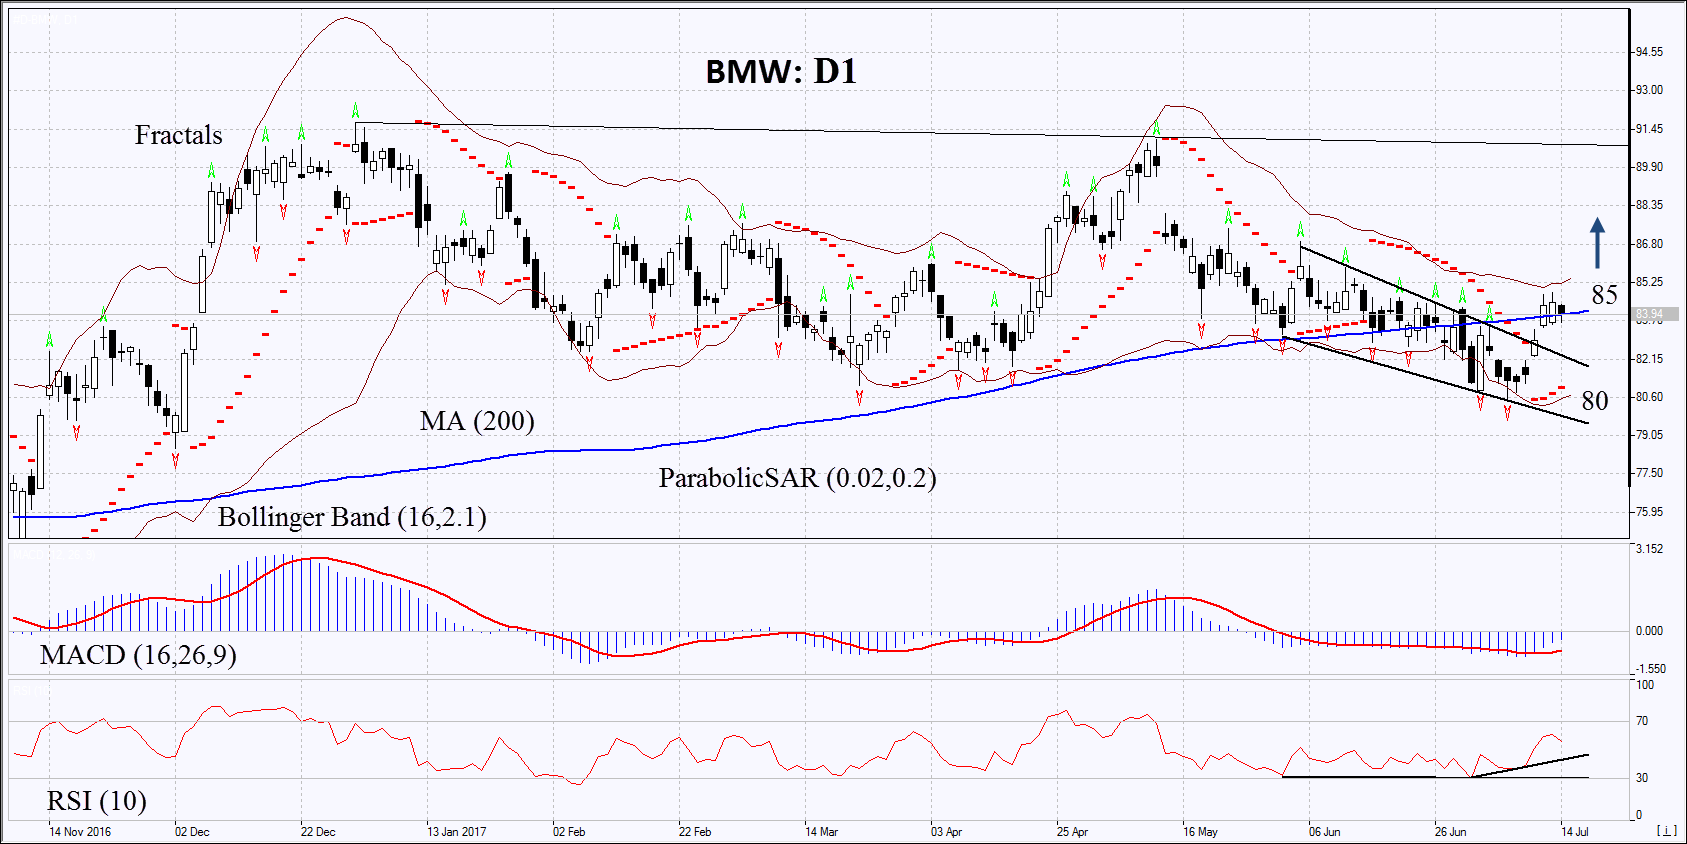
On the daily timeframe, BMW: D1 breached out of the downtrend and exceeded the 200-day moving average line. The further price increase is possible in case of the publication of positive corporate report, as well as in case of the total growth of the German stock index DAX.
- The Parabolic indicator gives a bullish signal.
- The Bollinger bands have widened, which means lower volatility. They are tilted upwards.
- The RSI is above 50. It has formed a positive divergence.
- The MACD gives a bullish signal.
The bearish momentum may develop in case BMW exceeds the upper Bollinger band at 85. This level may serve as an entry point. The initial stop loss may be placed below the last fractal low, the Parabolic signal, the lower Bollinger band and the 7-month low at 80. After opening the pending order, we shall move the stop to the next fractal low following the Bollinger and Parabolic signals. Thus, we are changing the potential profit/loss to the breakeven point. More risk-averse traders may switch to the 4-hour chart after the trade and place there a stop loss moving it in the direction of the trade. If the price meets the stop level at 80 without reaching the order at 85 we recommend cancelling the position: the market sustains internal changes that were not taken into account.
Summary of technical analysis:
| Position | Buy |
| Buy stop | above 85 |
| Stop loss | below 80 |