
Preparing for the publication of significant statistics
In this review, we suggest considering the personal composite instrument (PCI) "CAD vs. Currencies". It reflects the price dynamics of the Canadian dollar against other world currencies. Is there a possibility for the CAD_Index price to decline?
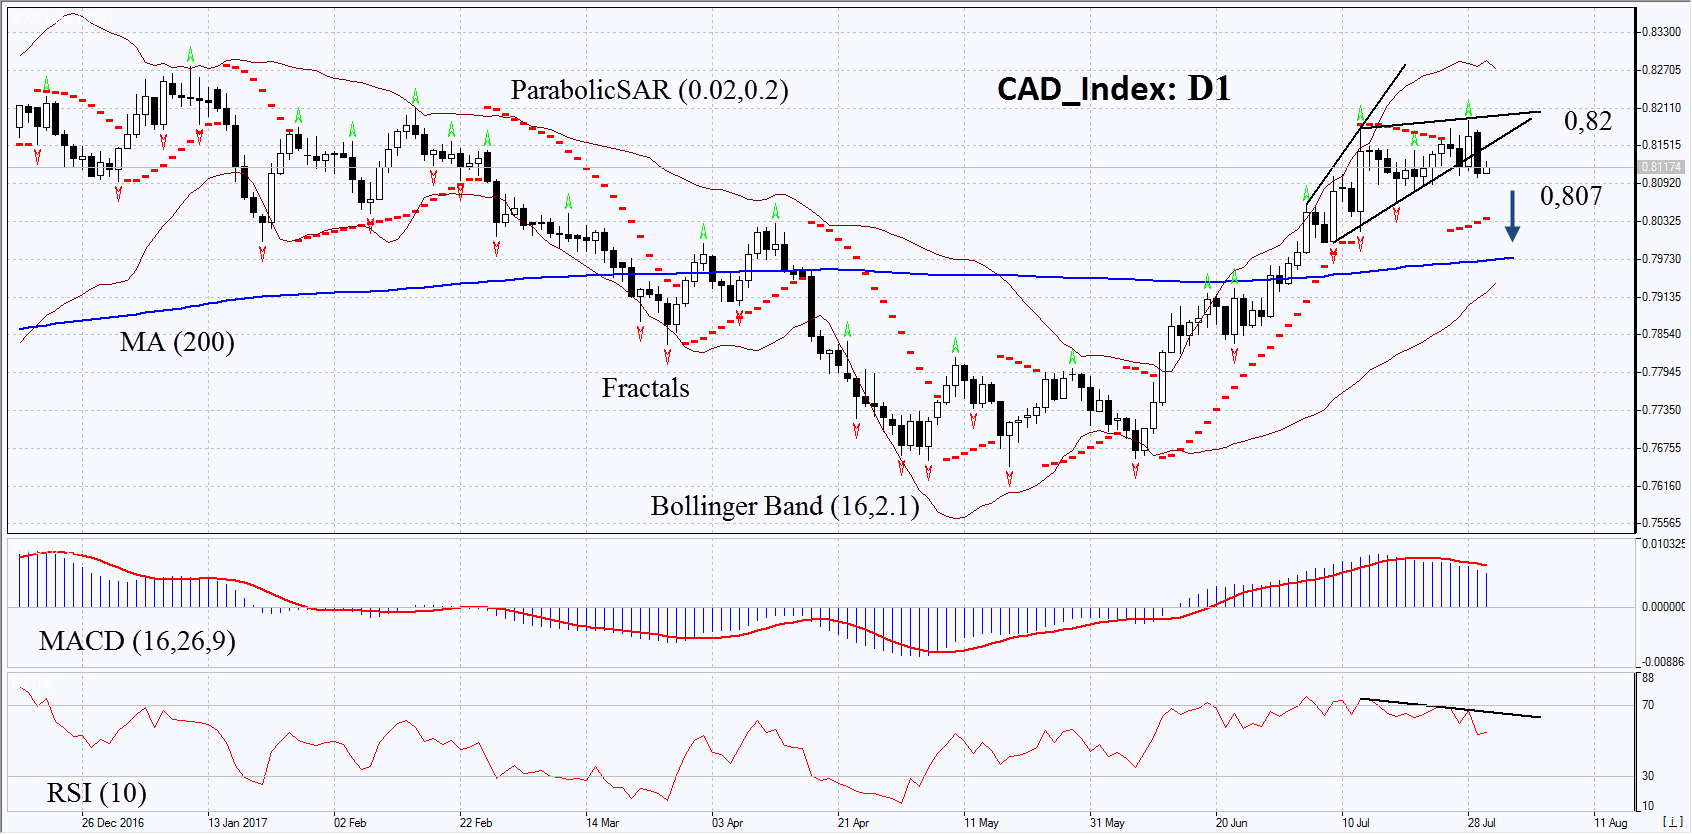
On the daily timeframe, CAD_Index: D1 has come out of the uptrend. The continuation of the downward correction is possible in case of the publication of weak economic data in Canada.
- The Parabolic indicator gives a bullish signal.
- The Bollinger bands have widened, which means higher volatility.
- The RSI Indicator is above 50. It has formed a weak negative divergence.
- The MACD Indicator gives a bearish signal.
The bullish momentum may develop in case CAD_Index drops below 0.807. This level may serve as an entry point. The initial stop loss may be placed above the last fractal high at 0.82. After opening the pending order, we shall move the stop to the next fractal high following the Bollinger and Parabolic signals. Thus, we are changing the potential profit/loss to the breakeven point. More risk-averse traders may switch to the 4-hour chart after the trade and place there a stop loss moving it in the direction of the trade. If the price meets the stop level at 0.82 without reaching the order at 0.807 we recommend cancelling the position: the market sustains internal changes that were not taken into account.
Summary of technical analysis:
| Position | Sell |
| Sell stop | below 0,807 |
| Stop loss | above 0,82 |