
High global stock estimate bearish for wheat prices
Global wheat inventory is expected rise in 2017-18. Will the wheat price continue falling?
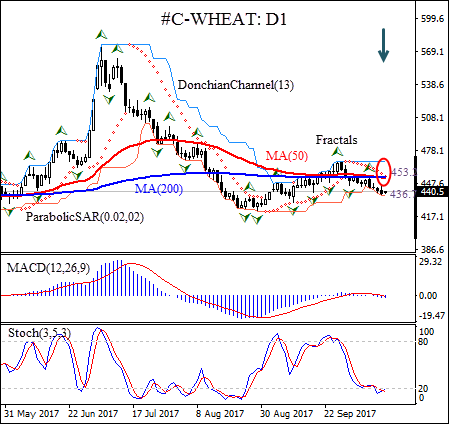
On the daily timeframe the WHEAT: D1 is trading with negative bias after retracing higher following the decline from fourteen-month high in mid-January. The 50-day and 200-day moving averages MA(50) and MA(200) have formed a Dead Cross chart pattern, highlighted by the red oval.
- The Donchian channel gives a neutral signal: it is flat.
- The MACD indicator gives a bearish signal: it is below the signal line and the gap is widening.
- The Parabolic indicator has formed a sell signal.
- The stochastic oscillator s rising from the oversold zone.
We expect the bearish momentum will continue after the price closes below the lower Donchian bound at 436.7. it can be used as an entry point for a pending order to sell. The stop loss can be placed above the last fractal high at 453.2. After placing the pending order the stop loss is to be moved following Parabolic signals. Thus, we are changing the profit/loss ratio to the breakeven point. If the price meets the stop loss level (453.2) without reaching the order (436.7), we recommend cancelling the position: the market sustains internal changes which were not taken into account.
Summary of technical analysis:
| Position | Sell |
| Sell stop | Below 436.7 |
| Stop loss | Above 453.2 |