
Brazil cut the tax on ethanol
Sugar prices reached a 2-month high amid the decline in the tax on ethanol in Brazil. Will the sugar prices continue to rise?
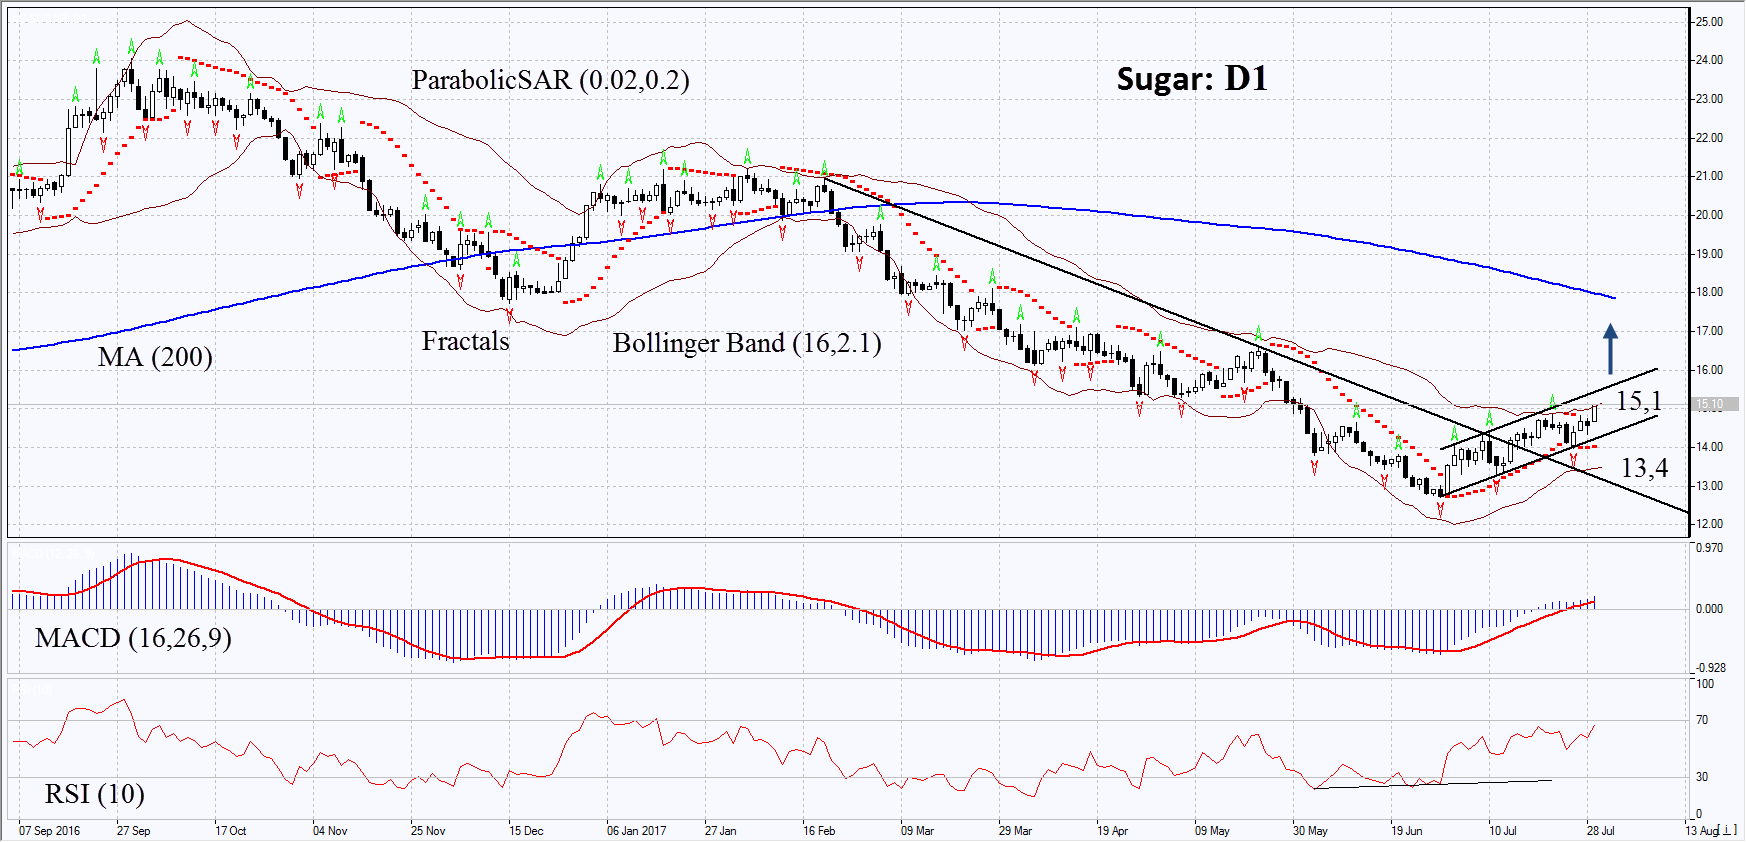
On the daily timeframe, Sugar: D1 has come out of the downtrend and is rising after rebounding from the 16-month low. The further price increase is possible in case of the reduction in the world production and the export from Brazil.
- The Parabolic indicator gives a bullish signal.
- The Bollinger bands have narrowed, which means lower volatility. They are tilted upwards.
- The RSI Indicator is above 50. No new divergence.
- The MACD Indicator gives a bullish signal.
The bullish momentum may develop in case Sugar exceeds the last fractal high and the upper Bollinger band at 15.1. This level may serve as an entry point. The initial stop loss may be placed below the last fractal low, the Parabolic signal and the lower Bollinger band at 13.4. After opening the pending order, we shall move the stop to the next fractal low following the Bollinger and Parabolic signals. Thus, we are changing the potential profit/loss to the breakeven point. More risk-averse traders may switch to the 4-hour chart after the trade and place there a stop loss moving it in the direction of the trade. If the price meets the stop level at 13.4 without reaching the order at 15.1 we recommend cancelling the position: the market sustains internal changes that were not taken into account.
Summary of technical analysis:
| Position | Buy |
| Buy stop | above 15,1 |
| Stop loss | below 13,4 |