
Soybean crop may decrease in the US and India
According to the German Oil World agency, the world soybean meal exports increased by 2.6% in July, 2017, compared to the same period of the last year. Will the SOYB prices grow?
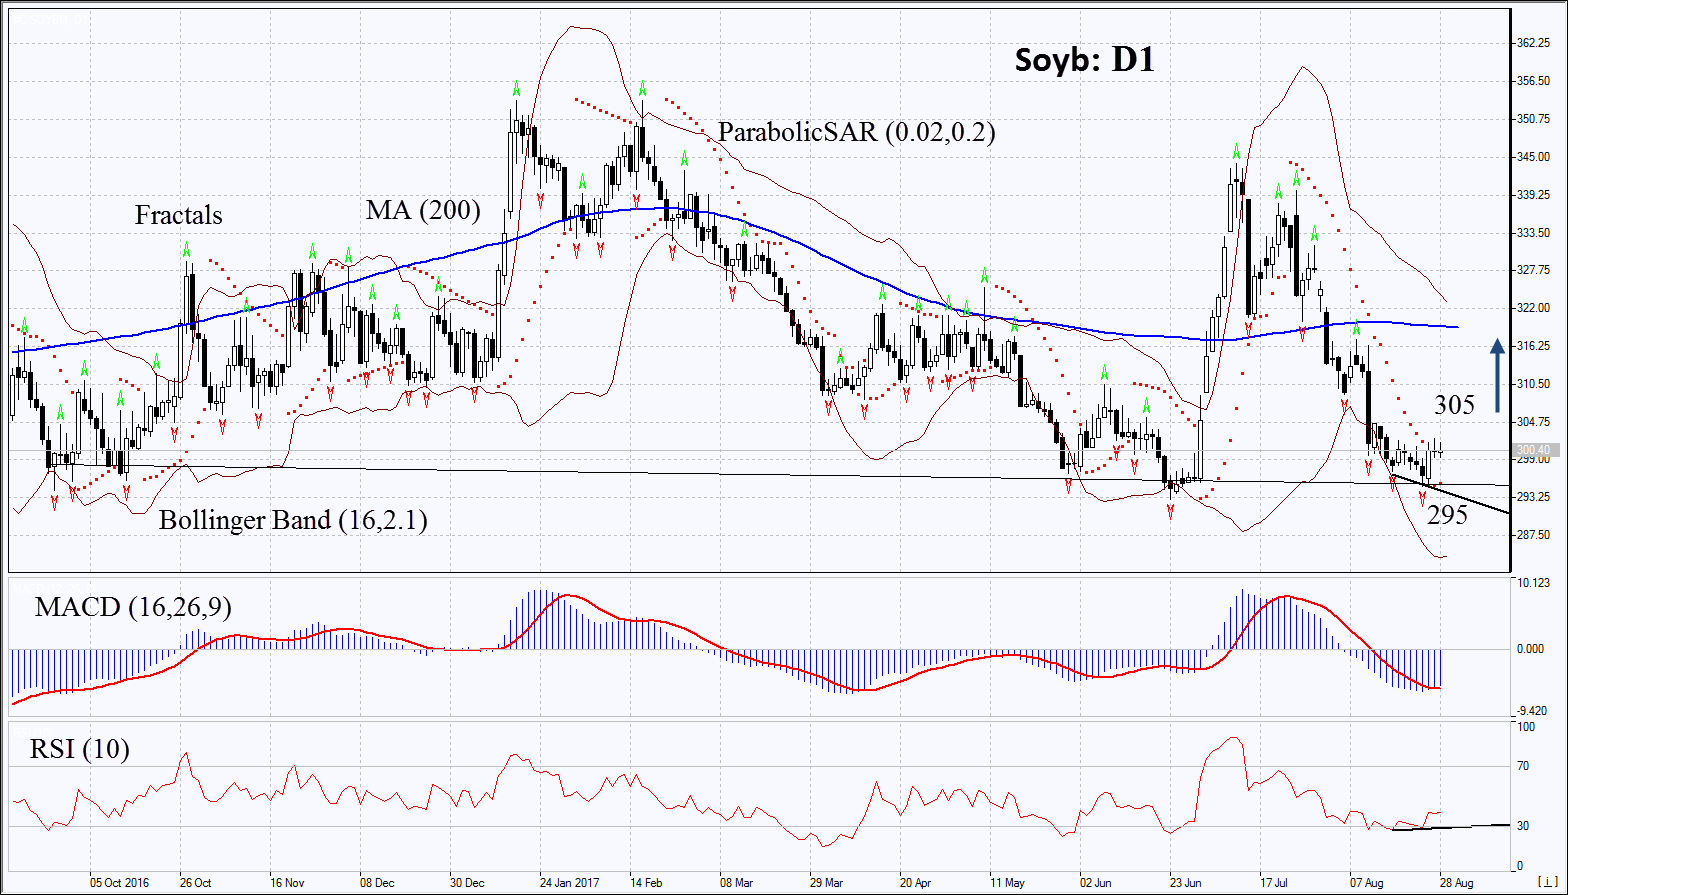
On the daily timeframe, SOYB: D1 reached the support level and is trying to correct upwards. The further price increase is possible in case of a decrease in world soybean crop.
- The Parabolic indicator gives a bullish signal.
- The Bollinger bands widened, which means higher volatility.
- The RSI Indicator is below 50. It has formed a positive divergence.
- The MACD Indicator gives a bullish signal.
The bullish momentum may develop in case SOYB exceeds the level of 305. This level may serve as an entry point. The initial stop loss may be placed below the last fractal low and the Parabolic signal at 295. After opening the pending order, we shall move the stop to the next fractal low following the Bollinger and Parabolic signals. Thus, we are changing the potential profit/loss to the breakeven point. More risk-averse traders may switch to the 4-hour chart after the trade and place there a stop loss moving it in the direction of the trade. If the price meets the stop level at 305 without reaching the order at 295 we recommend cancelling the position: the market sustains internal changes that were not taken into account.
Summary of technical analysis:
| Position | Buy |
| Buy stop | above 305 |
| Stop loss | below 295 |