
Increase in the world supply of rice
China is selling rice reserves of the 2013 harvest from its state reserves. Will the rice prices fall?
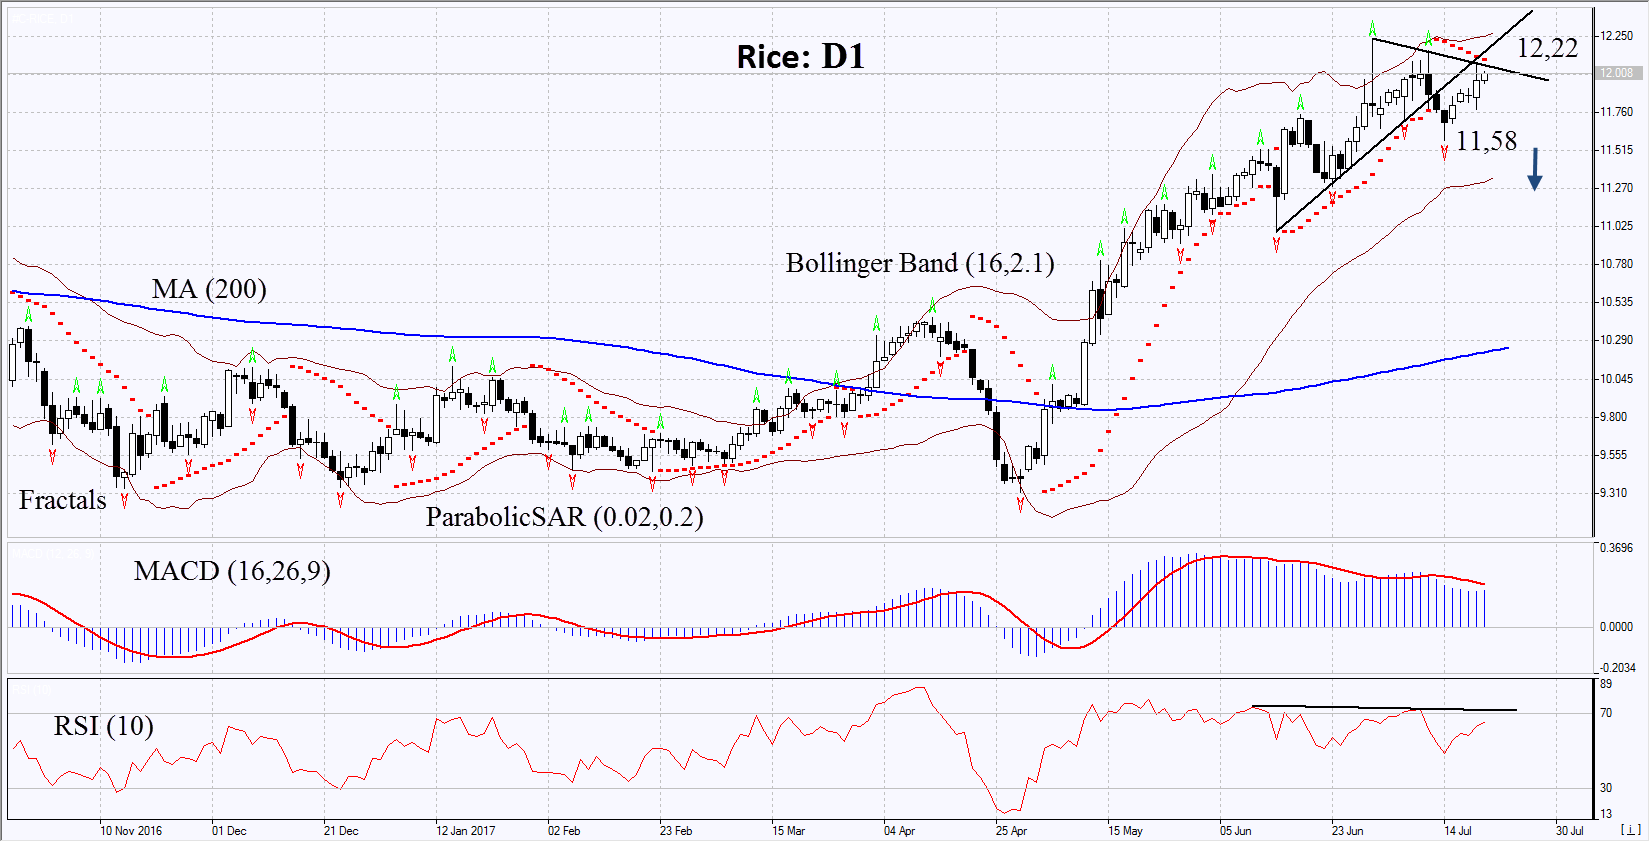
On the daily timeframe, Rice: D1 is trying to return to the rising price channel. The continuation of the downward correction is possible in case of an increase in rice supply in the world market.
- The Parabolic indicator gives a bearish signal.
- The Bollinger bands have widened, which means high volatility.
- The RSI is above 50. It has formed a weak negative divergence.
- The MACD gives a bearish signal.
The bearish momentum may develop in case Rice drops below the last low at 11.58. This level may serve as an entry point. The initial stop loss may be placed above the two last fractal highs, the Parabolic signal and the record high since November, 2015 at 12.22. After opening the pending order, we shall move the stop to the next fractal high following the Bollinger and Parabolic signals. Thus, we are changing the potential profit/loss to the breakeven point. More risk-averse traders may switch to the 4-hour chart after the trade and place there a stop loss moving it in the direction of the trade. If the price meets the stop level at 12.22 without reaching the order at 11.58 we recommend cancelling the position: the market sustains internal changes that were not taken into account.
Summary of technical analysis:
| Position | Sell |
| Sell stop | below 11,58 |
| Stop loss | above 12,22 |